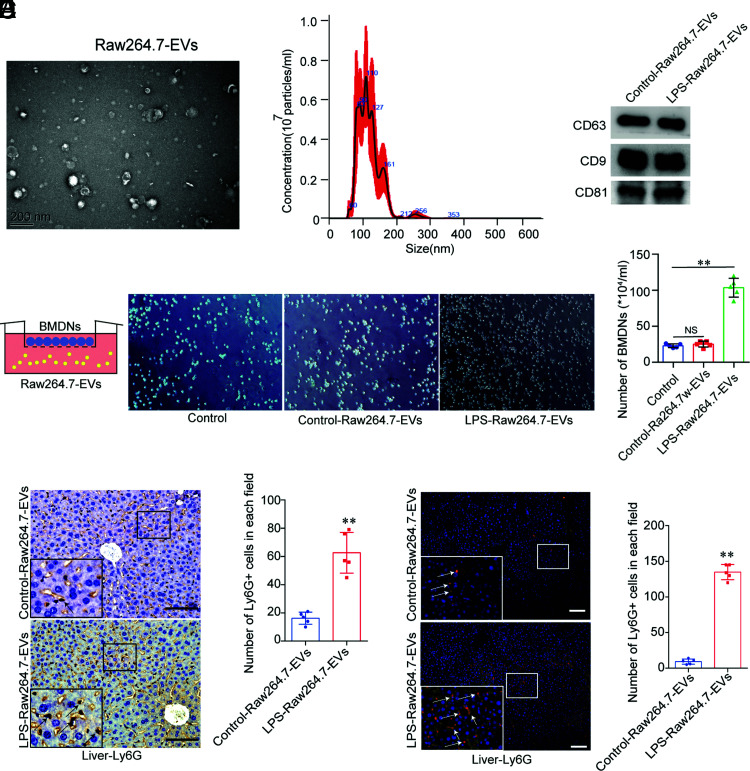
FIGURE 3.
LPS-induced Raw264.7 EVs attract neutrophils in vitro and in vivo. (A) Transmission electron microscopy of Raw264.7 EVs. Scale bar, 200 nm. (B) Nanoparticle tracking analysis to detect Raw264.7 EVs. (C) Biomarkers in the EVs from control and LPS-induced Raw264.7 EVs (CD63, CD9, and CD81), as detected by Western blotting. The experiments were repeated three times. (D) Control-Raw264.7-EVs– and LPS-Raw264.7-EVs–induced BMDN chemotaxis (mean ± SD) (original magnification × 200, n = 5 fields per group). The experiments were repeated three times. **p < 0.05 versus the control group. (E and F) Ly-6G+ cells (mean ± SD) in the liver of the control and LPS-Raw264.7-EV group mice (n = 6 per group) were detected by immunohistochemistry and immunofluorescence. **p < 0.01 versus the control-Raw264.7 group. Scale bars, 100 μm.

