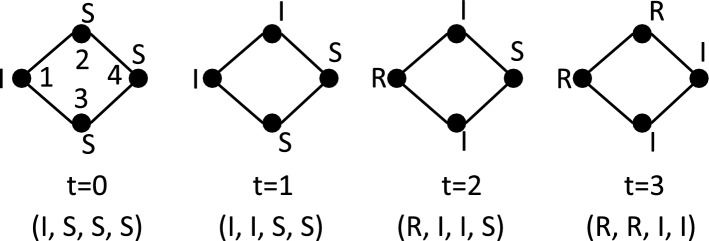
Figure 3:
Illustrative example of a 4-time step forward trajectory for a synchronous GDS where each vertex function is an SIR model. The dependency graph has 4 vertices and 4 edges. The infectious duration for each vertex (agent) is , and the probability of infection is p for each vertex. The vertices (agents) are labeled in the graph at the left, corresponding to the initial state x(0). The state corresponding to each time, displayed below the time, is given as . This particular sequence of states is dependent on the random numbers , , and their relation to p.

