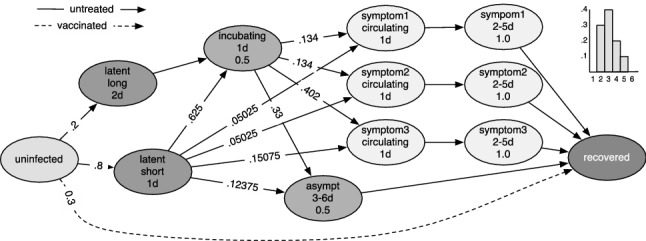
Figure 8:

PTTS for the H5N1 disease model. Ovals represent disease states, while lines represent the transition between states, labeled with the transition probabilities. The line type represents the treatment applied to an individual. The states contain a label and the dwell time within the state, and the infectivity if different from one.
