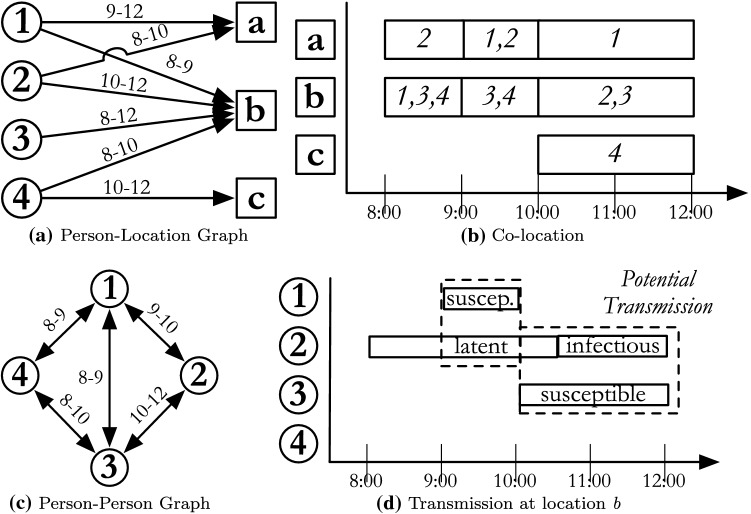
Figure 9:
An example social contact network: (a) the bipartite graph representation showing people visiting locations; (b) the temporal and spatial projection of the network; (c) the person-person graph showing interactions between temporally and spatially co-located people; (d) potential disease transmission between an infectious person 2, and susceptible people 1 and 3.

