
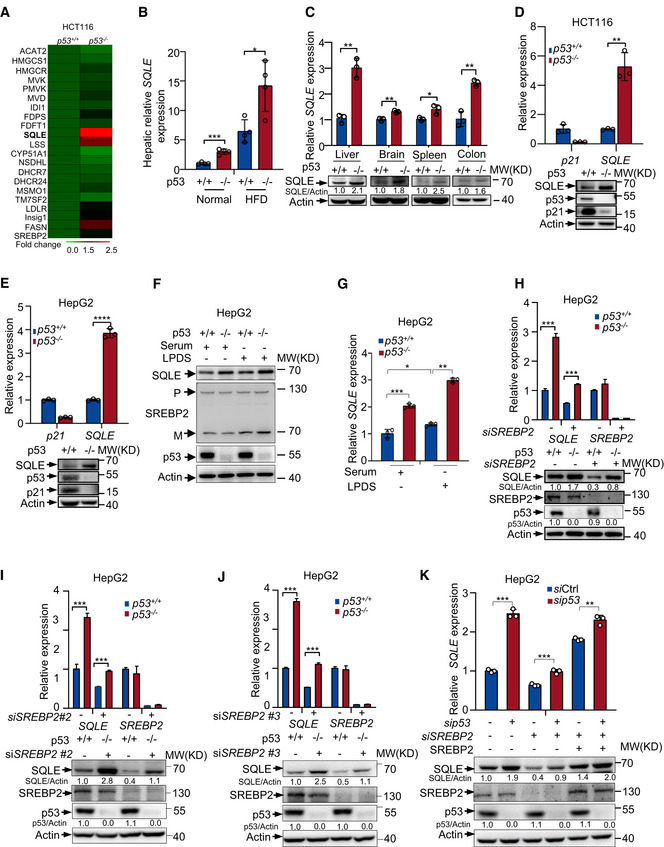
Figure 2. A SREBP2‐independent mechanism for p53‐mediated SQLE inhibition.
-
AHeat map analysis of 17 sterol biosynthesis genes and 3 other SREBP2 target genes from RNA‐seq data using p53 +/+ and p53 −/− HCT116 cells. Expression levels were normalized to the mean level of each gene among all samples and compared to p53 +/+ cells. Color scale indicates the expression fold change of target gene.
-
BmRNA expression of SQLE in the mouse liver of p53 +/+ and p53 −/− mice with normal or HFD diet.
-
CmRNA and protein levels of SQLE in different tissues of p53 +/+ or p53 −/− mice were determined by qRT–PCR and Western blot respectively.
-
D, ESQLE protein expression and mRNA levels were examined in p53 +/+ and p53 −/−HCT116 cells (D) and HepG2 cells (E). Actin was used as loading control.
-
F, Gp53+/+ and p53 −/− HepG2 cells were cultured for 48 h in medium containing fetal bovine serum (Serum) or lipoprotein‐depleted FBS (LPDS). Protein expression was shown by Western blotting (F). mRNA levels of SQLE were examined by qRT–PCR (G). P, premature SREBP2; M, mature SREBP2.
-
H–JProtein expression and mRNA levels of p53 +/+ and p53 −/− HepG2 cells treated with control siRNA or three separated sets of SREBP2 siRNAs for 72 h as indicated.
-
Kp53+/+ and p53 −/− HepG2 cells were treated with control siRNA or SREBP2 siRNA, followed by ectopically expressed RNA‐resistant SREBP2 for 48 h. mRNA and protein expression were examined by qRT–PCR and Western blotting.
Data information: In (B, C, D, E, G, H, I, J, K), bars represent mean ± s.d., *P < 0.05; **P < 0.01; ***P < 0.001; ****P < 0.0001; for (B), n = 4 biologically independent samples; for (C, D, E, G, H, I, J, K), n = 3 biologically independent samples; statistical significance was determined by two‐tailed unpaired t‐test.