
Figure EV3. Murine p53 transcriptionally regulates mouse SQLE.
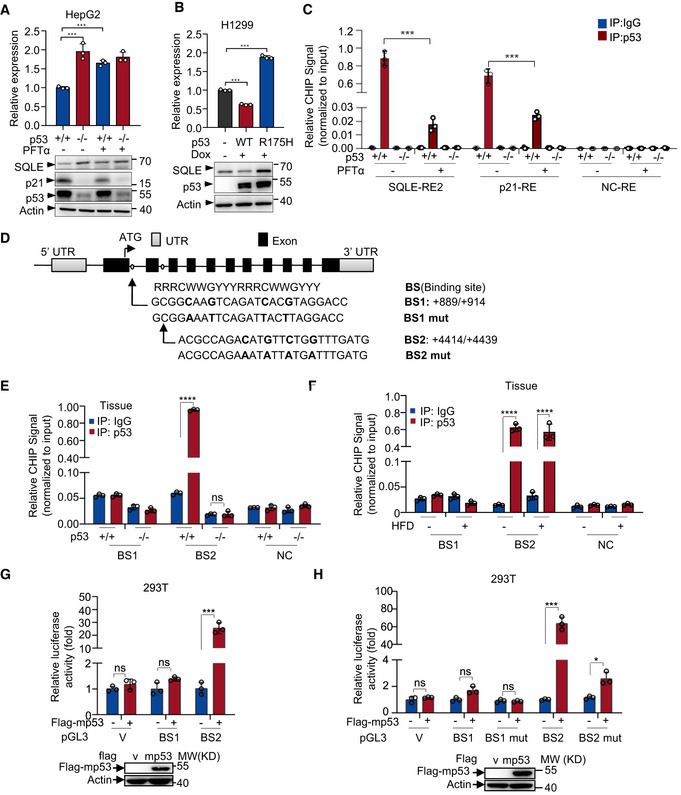
- p53+/+ and p53 −/− HepG2 cells were treated with PFTα (20 μM) for 24 h. mRNA and protein expression were analyzed by qRT–PCR and Western blotting respectively.
- mRNA and protein expression of H1299 p53‐inducible cells (wild‐type versus R175H mutant) treated with or without doxycycline (1 μg/ml).
- p53+/+ and p53 −/− HepG2 cells treated with or without PFTα (20 μM) for 24 h were analyzed by chromatin immunoprecipitation (ChIP) assay using normal IgG and anti‐p53 antibody as indicated.
- Schematic representation of mouse SQLE genomic structure. Shown are the exon/intron organization and two potential p53 binding sites (BS1 and BS2) and the corresponding mutant binding sites.
- p53+/+ and p53 −/− mice livers were analyzed by ChIP assay using normal IgG and anti‐p53 antibody.
- p53+/+ mice livers from Normal or HFD mice were analyzed by ChIP assay using normal IgG and anti‐p53 antibody.
- Luciferase reporter constructs containing mouse SQLE potential binding sites BS1 and BS2 were transfected into HEK293T cells together with control or mouse p53 expression vector for 48 h. Renilla vector pRL‐CMV was used as a transfection internal control. Relative levels of luciferase are shown. Protein expression is shown.
- Luciferase reporter constructs containing mouse SQLE potential binding sites BS1, BS2, and their corresponding mutant binding sites (BS1 mut and BS2 mut) were transfected into HEK293T cells together with control or mouse p53 expression vector for 48 h. Renilla vector pRL‐CMV was used as a transfection internal control. Relative levels of luciferase are shown. Protein expression is shown.
Data information: (A, B, C, E, F, G, H) Bars represent mean ± s.d., *P < 0.05; ***P < 0.001; ****P < 0.0001; n = 3 biologically independent samples; statistical significance was determined by two‐tailed unpaired t‐test.