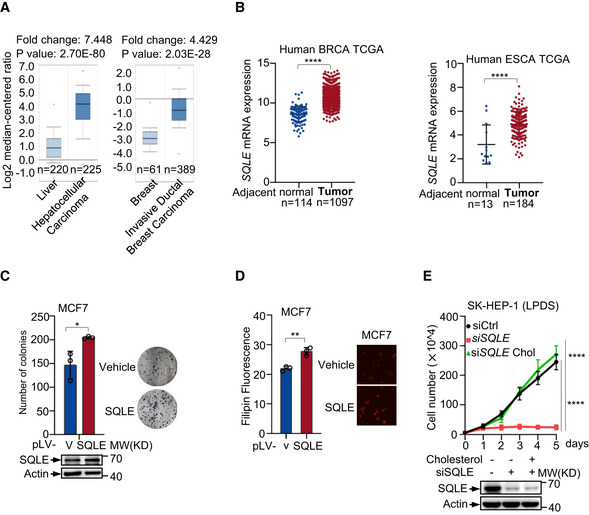
Figure EV4. SQLE is critical for tumor cell growth.

- Box plot comparing SQLE transcript levels in hepatocellular carcinoma, invasive ductal breast carcinoma, and their normal counterparts. The graphs were derived from ONCOMINE database. The differential expression data are centered on the median of expression levels and plotted on a log2 scale. Whiskers indicate minimum and maximum data values that are not outliers. The P value was calculated using a two‐sample t‐test. The number of samples (n) in each class is shown in below.
- SQLE gene expression in breast cancer (BRCA) and esophageal cancer (ESCA) were compared with adjacent normal tissue. Data were derived from TCGA‐Breast cancer and TCGA‐Esophageal cancer. Number of each sample (n, biological replicates) is shown. Bars represent mean ± s.d.
- Colony formation assay of MCF‐7 cells stably overexpressing SQLE (pLV‐SQLE) or control vector (pLV‐v) as indicated (left). Representative images of stained colonies were shown (right). Protein expressions are shown by Western blotting.
- Cholesterol concentrations of stably overexpressing SQLE or control vector MCF‐7 cells were determined by Filipin III staining.
- SK‐HEP‐1 cells transfected with control or SQLE siRNA were cultured in LPDS medium containing 5 μg cholesterol as indicated. Cell proliferation is shown. Protein expression was analyzed after transfection 48 h.
Data information: (C, D, E) Bars represent mean ± s.d., *P < 0.05; **P < 0.01; ****P < 0.0001; n = 3 biologically independent samples; statistical significance was determined by two‐tailed unpaired t‐test.
