
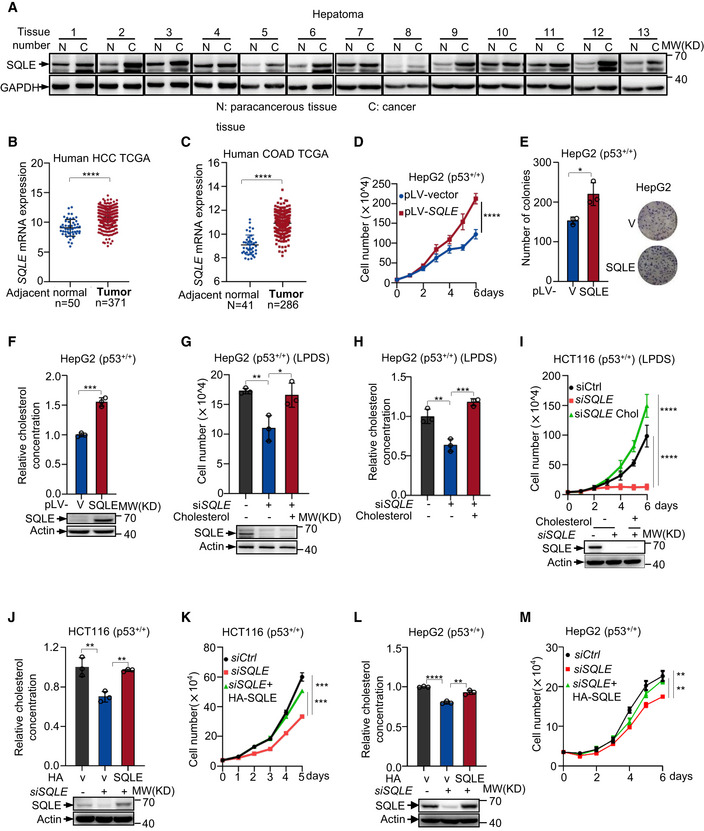
Figure 5. SQLE supports tumor growth through cholesterol.
-
AProtein expression of SQLE in human liver tumors (C) and non‐cancerous adjacent tissue (N) were analyzed by Western blotting.
-
BSQLE gene expression in HCC and adjacent normal tissue was analyzed in TCGA liver hepatocellular carcinoma (normal [n = 50] versus tumors [n = 371]).
-
CSQLE gene expression in COAD and adjacent normal tissue was analyzed in TCGA colon cancer (normal [n = 41] versus tumors [n = 286]).
-
D–Fp53+/+ HepG2 cells were stably overexpressed SQLE or vector control. Cell proliferation (D), number of colonies (E), and cholesterol concentration (F) are shown, respectively. Protein expression was analyzed using Western blotting (F bottom panel).
-
G, Hp53+/+ HepG2 cells transfected with control siRNA or SQLE siRNA were cultured in LPDS medium containing 5 μg cholesterol for six days as indicated. Cell number (G) and cholesterol concentration (H) were determined. Protein expression was analyzed by Western blotting after siRNA transfection 48 h (G bottom panel).
-
Ip53+/+ HCT116 cells transfected with control siRNA or SQLE siRNA for 48 h and then cells were cultured in LPDS medium containing 5 μg cholesterol for 6 days as indicated. Cell proliferation is shown. Protein expression was analyzed by Western blotting after siRNA transfection 48 h (bottom panel).
-
J–Mp53+/+ HCT116 cells (J and K) and p53 +/+ HepG2 cells (L and M) were transfected with SQLE siRNA or control siRNA in the presence or absence of exogenous SQLE cDNA for 48 h. Cholesterol concentration (upper panel) and protein expression (bottom panel) were determined (J and L). Cell proliferation is shown (K and M).
Data information: (B, C, D‐M), bars represent mean ± s.d., *P < 0.05; **P < 0.01; ***P < 0.001; ****P < 0.0001; n = 3 biologically independent samples; statistical significance was determined by two‐tailed unpaired t‐test.