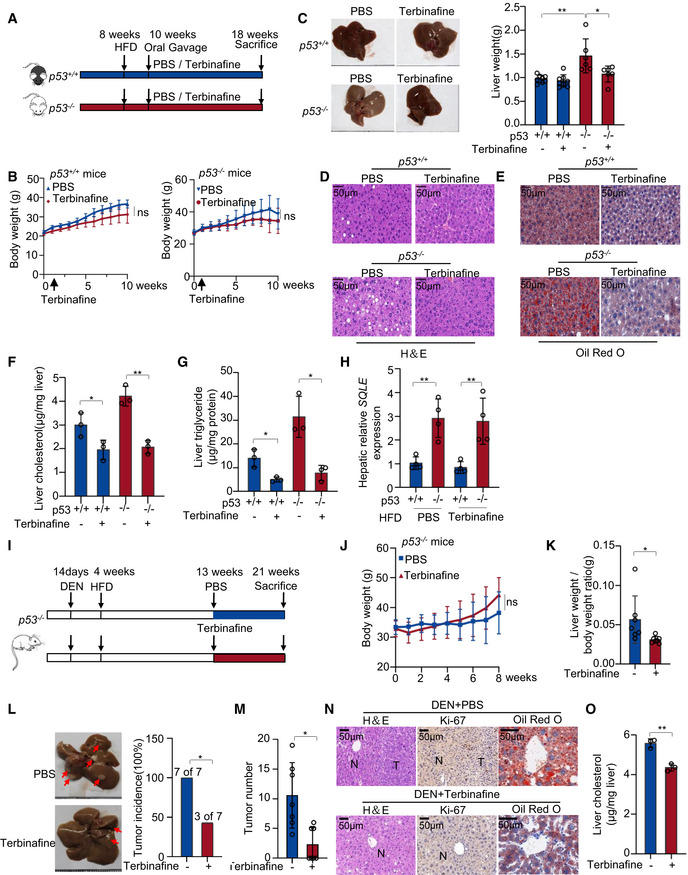
Figure 7. Terbinafine inhibits HFD‐induced lipid accumulation and liver cancer growth in p53 knockout mice.

-
A–H(A) Experimental design for the mouse model in Fig 7 (A‐H). p53 +/+ and p53 −/− C57BL/6N male mice (p53 +/+ mice n = 8;p53 −/− mice n = 6) were fed with HFD diet for 10 weeks and were administered PBS or terbinafine (80 mg/kg) every day for 8 weeks. (B) Mice body weight of p53 +/+ (left) and p53 −/− (right) mice. (C) Representative liver photos of mice (left), changes in liver weight (right), H&E staining (D), and oil red staining (E) of liver tissues are shown, respectively. Total liver cholesterol concentrations (F) and triglyceride levels (G) of each group were examined. (H) SQLE mRNA expression of mice liver tissues by qRT–PCR.
-
I–O(I) Experimental design for the mouse model in Fig 7I–O. p53 −/− C57BL/6N male mice (n = 7) were injected with a single dose of diethylnitrosamine (DEN) (25 mg/kg) at 2 weeks and then fed with HFD diet at 4 weeks. Oral administration of terbinafine was given at 13 weeks old as indicated. Body weight (J) and liver/body weight ratio (K) of mice are shown. Shown are liver tumor incidence (L) and tumor numbers (M). (N) H&E (left), Ki‐67 (middle) and oil red O (right) staining of livers of mice. (O) Total liver cholesterol concentrations of mice were examined.
Data information: (B, C, F, G, H, K, L, M, O), Bars represent mean ± s.d., ns, not significant; *P < 0.05; **P < 0.01; (B, C), p53 +/+ mice (n = 8), p53 −/− mice (n‐6) biological replicates; (F, G, H, O), n = 3 biologically independent samples; (J, K, L, M), n = 7 biologically independent samples; statistical significance was determined by two‐tailed unpaired t‐test.
