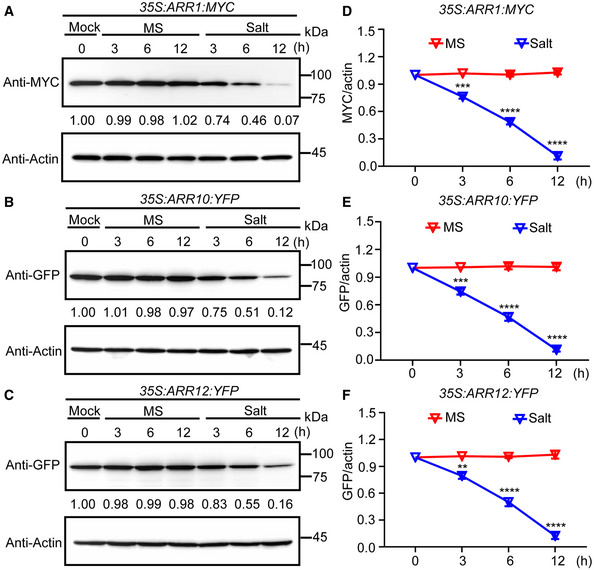
Figure 1. The protein levels of ARR1/10/12 decrease under salt treatment in a time‐dependent manner.

-
A–CARR1/10/12 protein levels were examined by western blot when 5‐day‐old seedlings of 35S:ARR1:MYC, 35S:ARR10:YFP, and 35S:ARR12:YFP were treated with or without 200 mM NaCl for the indicated time points. Actin was used as the internal reference. The relative intensity of band detected by anti‐MYC or anti‐GFP antibody to that by anti‐Actin antibody without treatment was set to 1.0.
-
D–FQuantification analysis of the protein levels of ARR1/10/12 in (A–C).
Data information: In (D–F), the statistical analyses of the related density of western blotting bands were performed using ImageJ software based on three independent biological replicates. Values are means ± SD (n = 3). **, ***, and **** indicate significant difference to the corresponding controls with P < 0.01, P < 0.001, and P < 0.0001, respectively (Student's t‐test).
Source data are available online for this figure.
