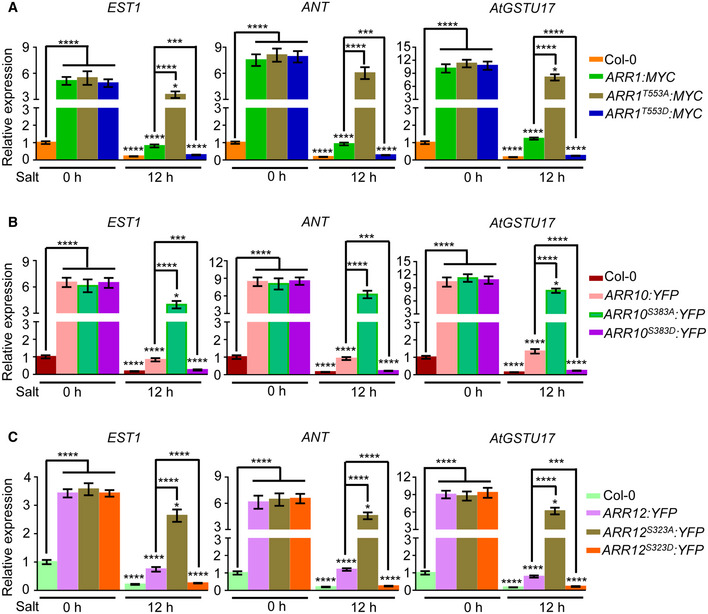
Figure EV5. Expression analysis of direct downstream targets of ARR1/10/12.

-
A–CThe relative expression of direct downstream targets of ARR1/10/12 such as EST1, ANT, and AtGSTU17 in 7‐day‐old seedlings treated with 200 mM NaCl for given time. Actin2 gene and UBQ1 gene were analyzed as internal controls. Gene expression levels in wild‐type control plants treated with NaCl for 0 h were set to 1.0.
Data information: Data shown are means ± SD of three biological replicates. *P < 0.05, ***P < 0.001, ****P < 0.0001 (Student's t‐test).
