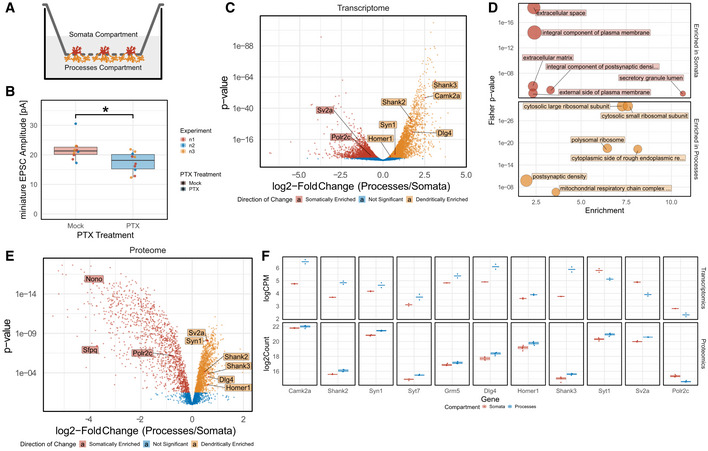
Figure 1. Compartment‐specific localization of neuronal transcripts and proteins.

- Schematic of the workflow for the culture of primary hippocampal neurons and 48 h of PTX treatment.
- Quantification of miniature EPSC amplitudes in mock‐ and PTX‐treated hippocampal neurons. (n = 10 neurons per condition from three independent experiments, independent two‐sample Wilcoxon–Mann–Whitney U‐test, *P < 0.05).
- Volcano plots demonstrating enrichment of transcripts in either the somatic (red) or process (yellow) compartment with representative genes highlighted.
- Top Gene Ontology Pathway Analysis for transcripts enriched in the somatic and process compartment.
- Volcano plots demonstrating enrichment of proteins in either the somatic (red) or process (yellow) compartment with representative genes highlighted.
- Quantification of the highlighted genes enriched in either the somata or processes at the transcript or protein level. (Upper row: Scatterplots of transcript level; n = 2; crossbar represents mean. Lower row: Boxplot of protein levels; n = 4). Boxplots: central line: median; box: 25th to 75th percentile; whiskers: until last data point within 1.5× interquartile range (IQR).
