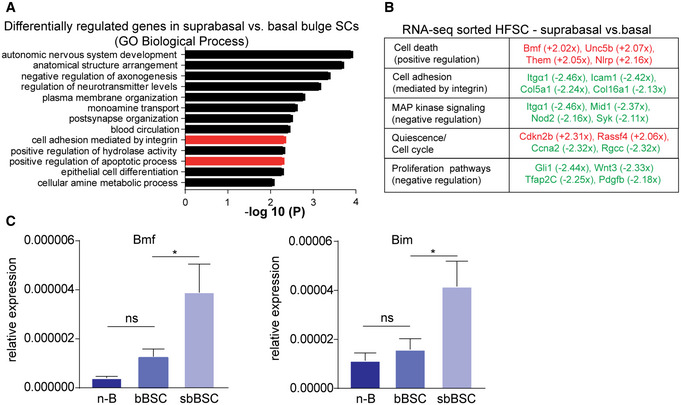
Figure 3. Suprabasal BSCs are prone to detachment‐induced apoptosis.

- GO classification of differentially regulated genes in P50 suprabasal BSCs (CD34+/Itgα6low) compared with basal BSCs (CD34+/Itgα6high) clustered for biological process (clustering and statistical analysis done with Metascape, according to Zhou et al, 2019). Columns of interest in red.
- Functional classification of selected differentially expressed genes in sorted suprabasal BSC vs basal BSC after RNAseq analysis (red: upregulated genes, green: downregulated genes; fold change > 2, P < 0.05; statistical analysis done according to Wagle et al, 2015).
- qRT–PCR for mRNA expression of the anoikis‐related markers Bim and Bmf in sorted n‐B (non‐bulge), bBSC (basal BSCs) and sbBSC (suprabasal BSCs; n = 3 biological replicates; mean ± standard error of mean [SEM]; *P < 0.05, ns, not significant, two‐way ANOVA test).
