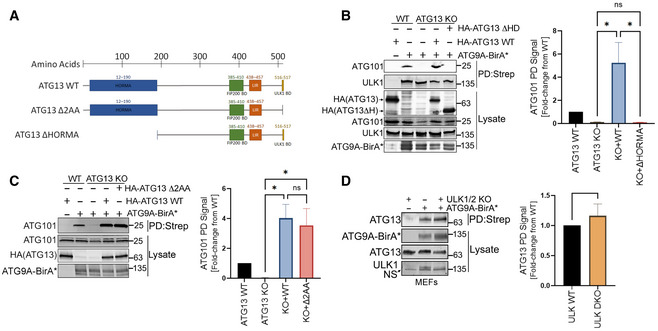
Schematic representation of ATG13 mutations used in the study.
HA‐ATG9A‐BirA* was expressed in HCT‐116 ATG13 WT, ATG13 KO, or ATG13 KO cells reconstituted with WT ATG13 or ATG13 ΔHORMA. Cells were grown in full DMEM media, treated with 50 µM biotin for 12 h, followed by detergent lysis and incubation with streptavidin resin. The graph on right shows quantification of normalized ATG101 infrared signal. Mean ± SEM, n = 3 (biological replicates). Significance measured using RM one‐way ANOVA test followed by Fisher’s LSD tests.
Cells were treated as in panel B but included reconstitution with ATG13 Δ2AA mutant. The graph on right shows quantification of normalized ATG101 infrared signal. Mean ± SEM, n = 3 (biological replicates). Significance measured using RM one‐way ANOVA test followed by Fisher’s LSD tests (right).
HA‐ATG9A‐BirA* was overexpressed in WT and ULK1/2 Double KO MEFs. Cells were subjected to streptavidin pulldown and immunoblotting with indicated antibodies. The graph on right shows quantification of normalized ATG13 infrared signal. Mean ± SEM. n = 3 (biological replicates). Significance measured using one‐sample t‐test compared with hypothetical mean of 1 (right). ns
P > 0.05, *P ≤ 0.05, **P ≤ 0.01, ***P ≤ 0.001, ****P ≤ 0.0001.