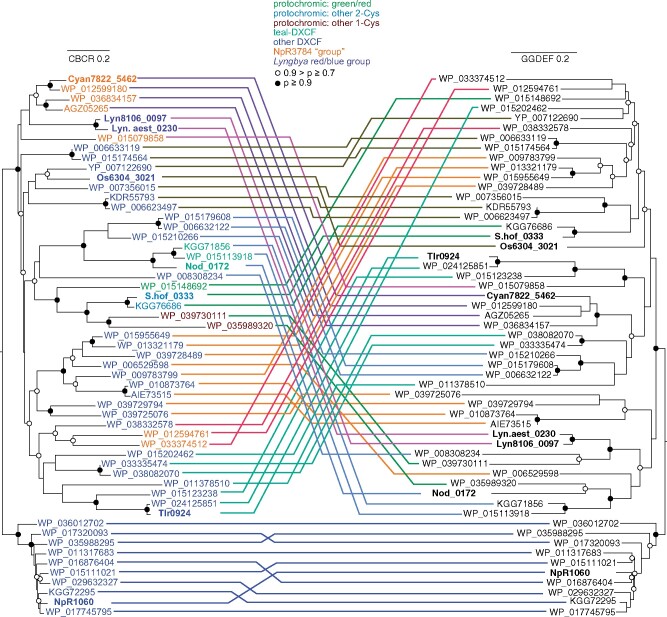
Figure 2.
Tanglegram view of CBCR (left) and GGDEF (right) maximum-likelihood phylogenies. Bold lettering indicates proteins further described in paper. Color of CBCR lettering matches subfamily seen at top of tanglegram. Connecting lines are colored to facilitate comparison of the two trees; instances of co-evolution should thus yield coherent groups of connecting lines. The cluster of proteins which includes NpR1060 was chosen as an arbitrary outgroup and is placed at the bottom of both phylogenies. Scale bars for each tree indicate 0.2 substitutions per position.

