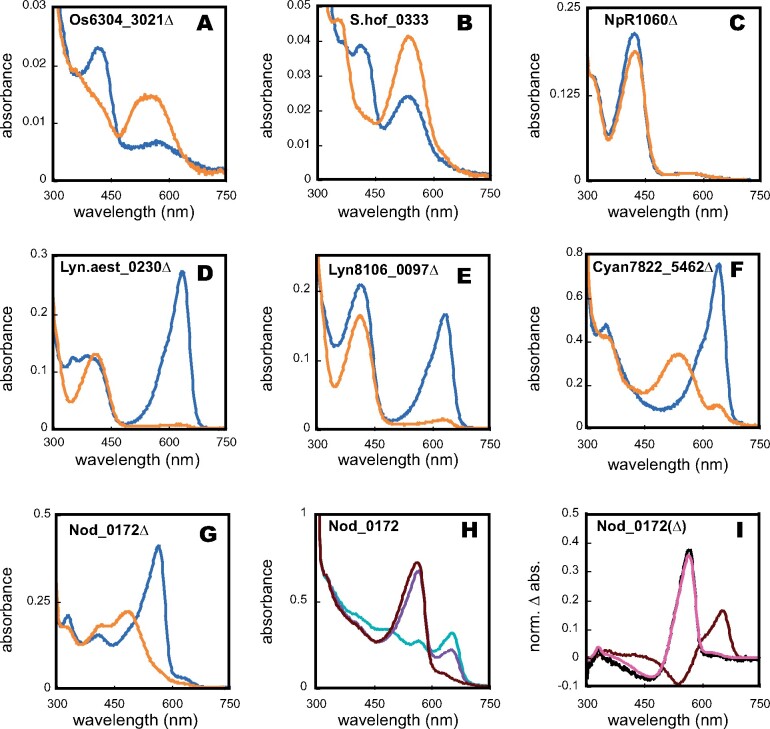
Figure 4.
Spectral analysis of selected CBCR-GGDEF proteins. Absorbance spectra of (A) Os6304_3021Δ; (B) S.hof_0333; (C) NpR1060Δ; (D) Lyn.aest_0230Δ; (E) Lyn8106_0097Δ; (F) Cyan7822_5462Δ; (G) Nod_0172Δ; (H) Nod_0172; and (I) Nod_0172 (GAF1) and Nod_0172Δ. For panels A–G, blue traces represent 15Z states and orange traces represent 15E states. For panel H, the teal trace represents the sample irradiated with saturating teal light (500 ± 10 nm). Subsequent irradiation with violet light (400 ± 35 nm; violet trace) or red light (650 ± 20 nm; black red trace) is shown. Panel I depicts the photochemical difference spectra of GAF1 (black red trace), GAF2 (coral trace; obtained by subtraction of the violet trace from the red trace in panel H), and that of Nod_0172Δ (black trace).

