
Figure 5.
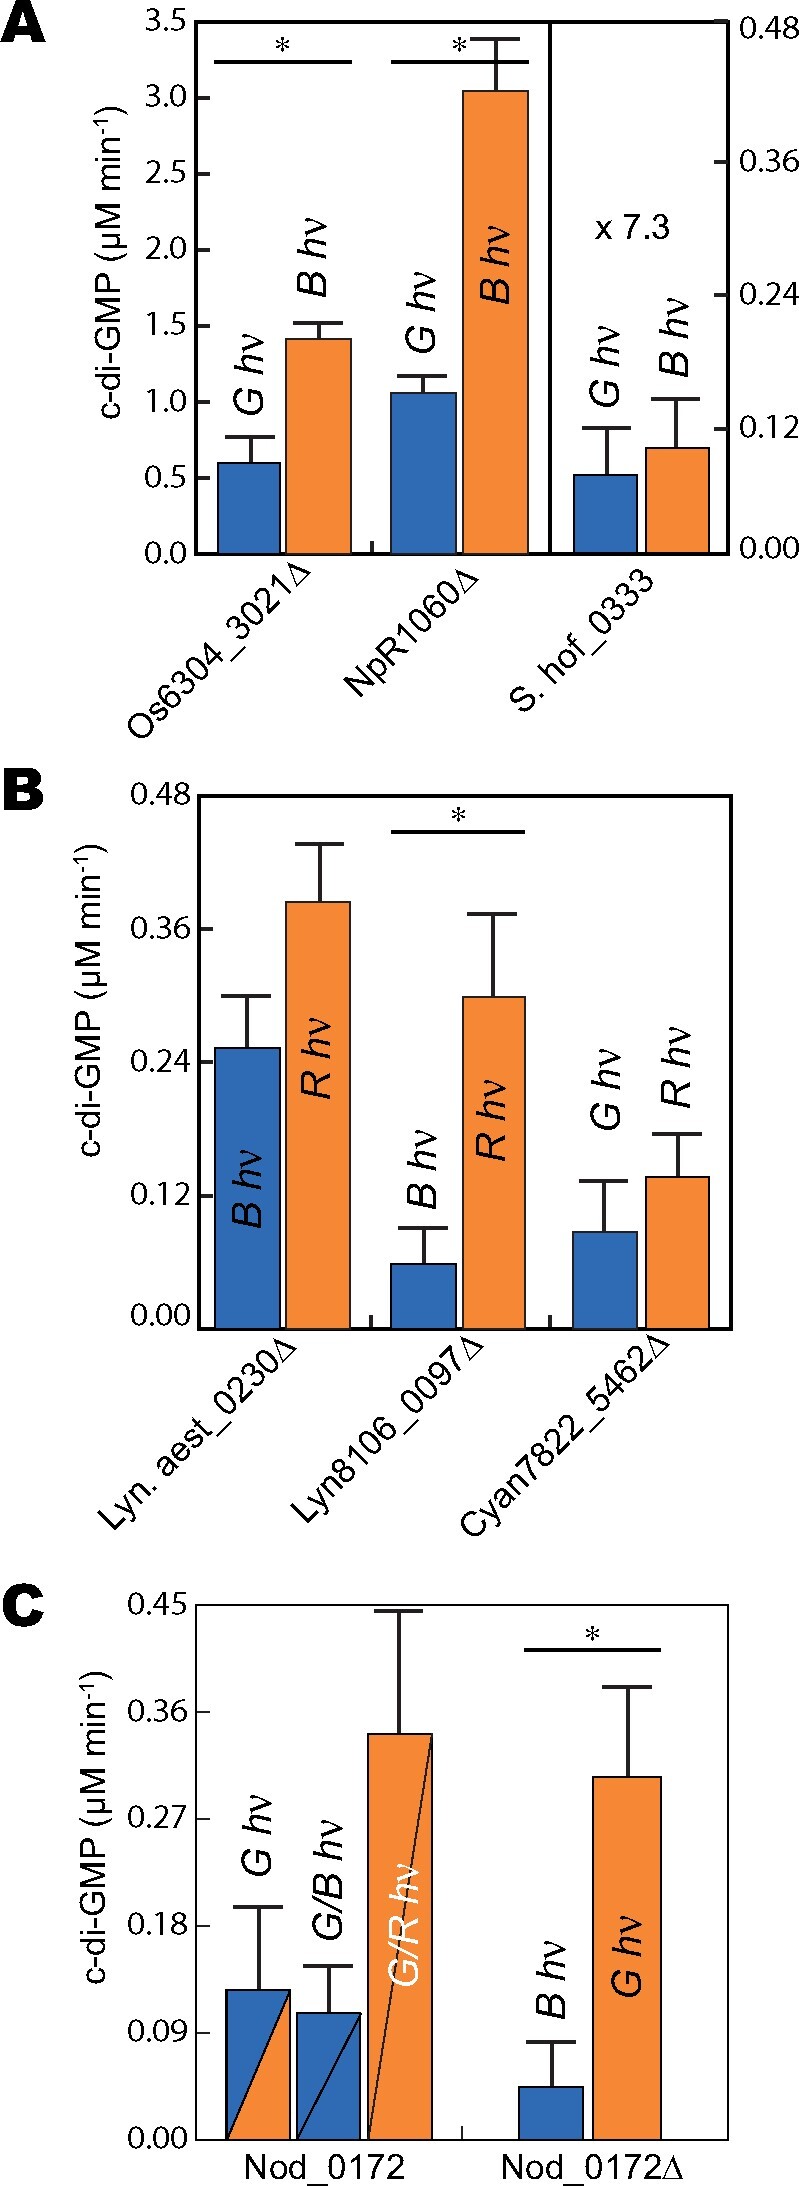
DGC activities of selected CBCR-GGDEF proteins. A, NpR1060Δ, Os6304_3021Δ, and S.hof_0333; B, Lyn.aest_0230Δ, Lyn8106_0097Δ, and Cyan7822_5462Δ; C, Nod_0172 and Nod_0172Δ. Total protein concentration of each protein is 5 µM. For panels A and B, the color of light used for sample irradiation is indicated above each bar column, and those columns are colored blue or orange for samples maintained in 15Z or 15E states, respectively. For panel C, the color of light used for sample irradiation is indicated above/within each bar column. Nod_0172 samples labeled G/B and G/R were first irradiated with saturating green light and then maintained under blue or red, respectively. Nod_0172 bar columns are divided by a line and are colored blue or orange to represent the photostate of GAF1 (upper left) and GAF2 (lower right). Error bars were calculated as standard deviation of all replicates (n = 3); Statistically significant differences between photostates are indicated with asterisks (P ≤ 0.025; Student’s t test). G hν, green light; B hν, blue light; R hν, red light.