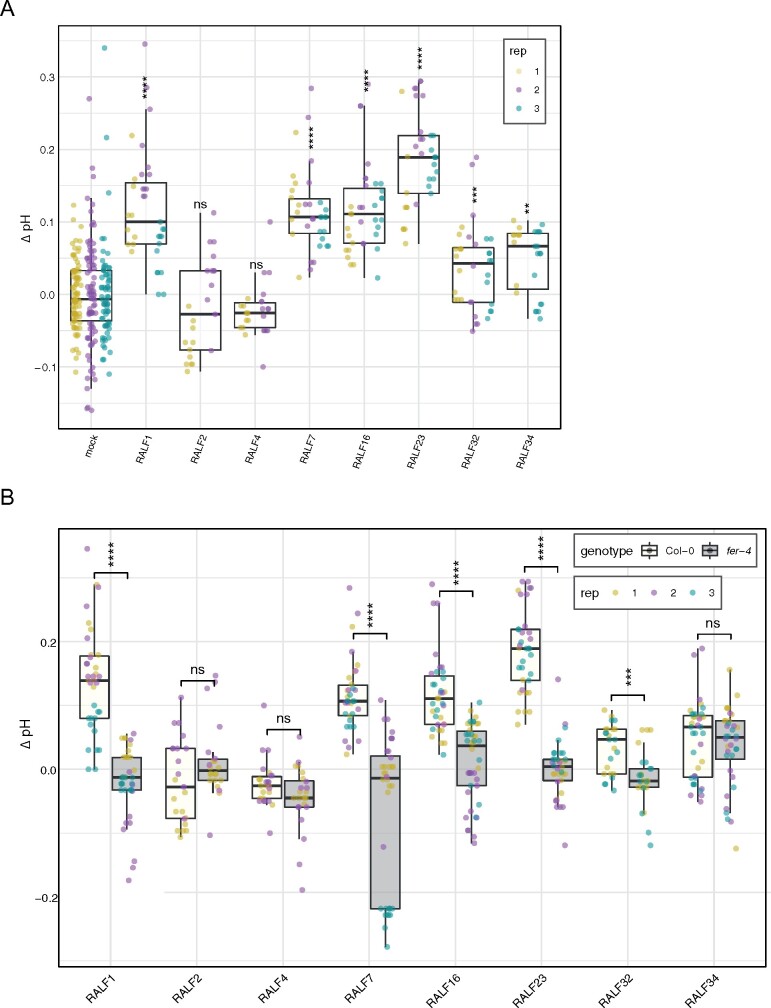
Figure 4.
Alkalinization and growth inhibition properties correspond in a FER-dependent manner. A, Change in pH (ΔpH) measurements of 7-d-old seedlings recorded 4 h after addition of RALF peptides. Asterisks indicate significance levels of a two-tailed t test in which each treatment was compared with the corresponding mock treatment. B, Change in pH measurements of 7-d-old seedlings recorded 4 h after addition of RALF peptides relative to mock treatment. Col-0 data are shown in white and fer-4 data in gray. A and B, Data from three independent repetitions are shown (colors indicate different replicates). Upper and lower whiskers represent 1.5 times and −1.5 times interquartile range; upper and lower hinges represent 25% and 75% quartiles; and middle represents median or 50% quartile. Asterisks indicate significance levels of a two-tailed t test comparing each treatment in fer-4 to the corresponding in Col-0: ns (P-value > 0.05), **(P-value ≤ 0.01), ***(P-value ≤ 0.001), and ****(P-value ≤ 0.0001).

