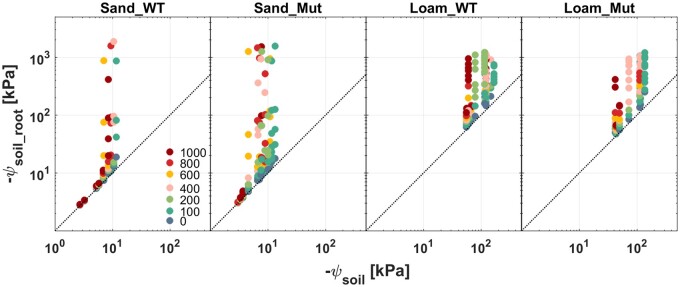
Figure 6.
Relation between ψsoil_root and ψSoil for the WT and Mut grown in sand and loam. ψsoil_root was obtained from simulations using the soil–plant hydraulic model (Supplemental Method S1). The points correspond with the P(E) curves, which are shown in Figure 5 and Supplemental Figure S3. Matric potential with increasing E is presented by the color of light intensity steps from blue-green to red (the legend in the first subplot; unit: µmol m−2 s−1).

