Figure 1.
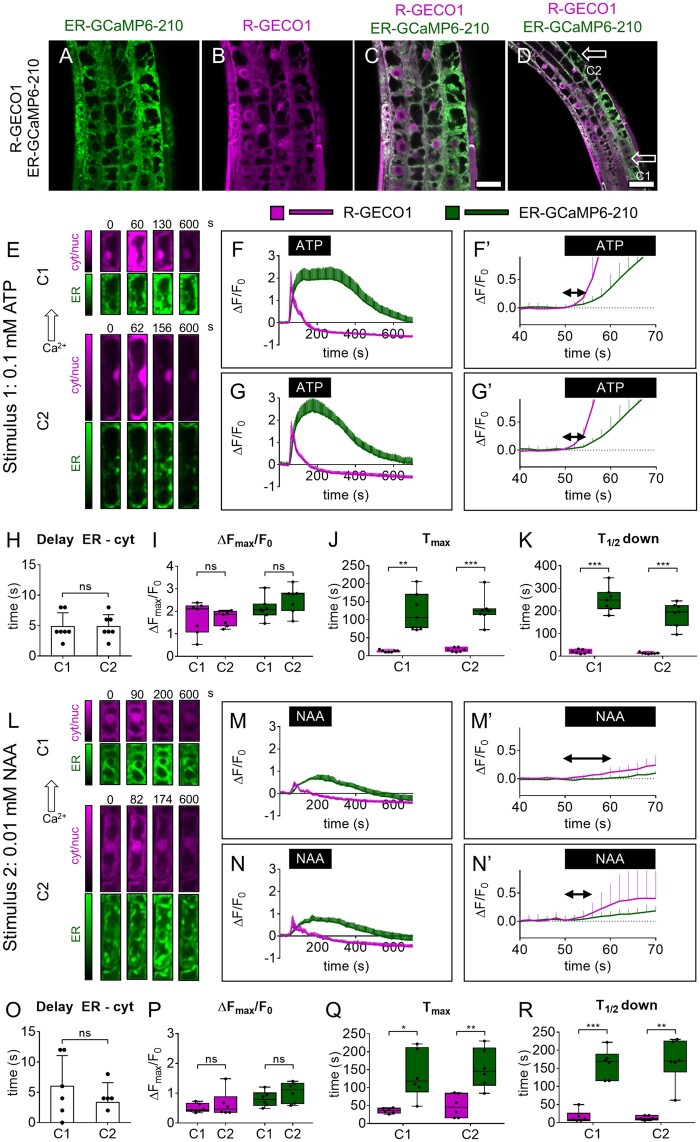
Simultaneous cytosolic and ER Ca2+ analyses in root tip at the single-cell level. A–D, Images of root-tip cells of a representative pUBQ10-ER-GCaMP6-210 × pUBQ10-R-GECO1 seedling. A, Green: ER-GCaMP6-210 fluorescence. B, Magenta: R-GECO1 fluorescence. C, Overlay of (A) and (B). Scale bar 25 µm. D, Lower magnification image of (C). Scale bar 50 µm. E, Exemplary false-color images illustrate R-GECO1 (magenta) and ER-GCaMP6-210 (green) of cell 1 (C1) and cell 2 (C1) in root tips of seedlings expressing simultaneously the two Ca2+ sensors at steady-state and during the Ca2+ transient induced by the treatment with 0.1 mM ATP for 3 min. F, R-GECO1 and ER-GCaMP6-210 normalized fluorescence changes of C1 over the time acquired under continuous perfusion and treated with 0.1 mM ATP for 3 min, as indicated by the black box on the x-axis. F′, same as panel (F) but x-axis, y-axis scales, and ranges adjusted. G, R-GECO1 and ER-GCaMP6-210 normalized fluorescence changes of C2 over the time acquired under continuous perfusion and treated with 0.1 mM ATP for 3 min, as indicated by the black box on the x-axis. G′ same as panel (G) but x-axis, y-axis scales, and ranges adjusted. The double arrow in (F′) and (G′) indicates the delay time quantified in (H). H, Mean delay of the fluorescence increase of the ER-GCaMP6-210 compared to the fluorescence change of the R-GECO1 for C1 and C2 following 0.1 mM ATP administration. I, Maximal peaks of ER-GCaMP6-210 and R-GECO1 fluorescence signals for C1 and C2 after 0.1 mM ATP administration. J, Time required to reach maximal peaks of ER-GCaMP6-210 and R-GECO1 fluorescence emissions for C1 and C2 after stimulus administration. K, Time required to pass half-maximal ER-GCaMP6-210 and R-GECO1 fluorescence signals during recovery after the stimulus. n = 7. L, Exemplary false-color images illustrate R-GECO1 (magenta) and ER-GCaMP6-210 (green) of C1 and C2 in root tips of seedlings expressing simultaneously the two Ca2+ sensors, at steady-state and during the Ca2+ increase induced by the treatment with 0.01 mM NAA for 3 min. M, R-GECO1 and ER-GCaMP6-210 normalized fluorescence changes of C1 over the time acquired under continuous perfusion and treated with 0.01 mM NAA for 3 min, as indicated by the black box on the x-axis. M′, Same as panel (M) but x-axis, y-axis scales, and ranges adjusted. N, R-GECO1 and ER-GCaMP6-210 normalized fluorescence changes of C2 over the time acquired under continuous perfusion and treated with 0.01 mM NAA for 3 min, as indicated by the black box on the x-axis. N′, same as panel (N) but x-axis, y-axis scales, and ranges adjusted. The double arrow in (M′) and (N′) indicates the delay time quantified in (O). O, Mean delay of the fluorescence increase of the ER-GCaMP6-210 compared to the fluorescence change of the R-GECO1 for C1 and C2 following 0.01 mM NAA administration. P, Maximal peaks of ER-GCaMP6-210 and R-GECO1 fluorescence signals for C1 and C2 after 0.01 mM NAA administration. Q, Time required to reach maximal peaks of ER-GCaMP6-210 and R-GECO1 fluorescence signals for C1 and C2 after stimulus administration. R, Time required to pass half-maximal ER-GCaMP6-210 and R-GECO1 fluorescence emissions during recovery after the stimulus. n = 6. Error bars = sd, ns = not significant, *P ≤ 0.05, **P ≤ 0.005, ***P ≤ 0.0005 (Student’s t test).

