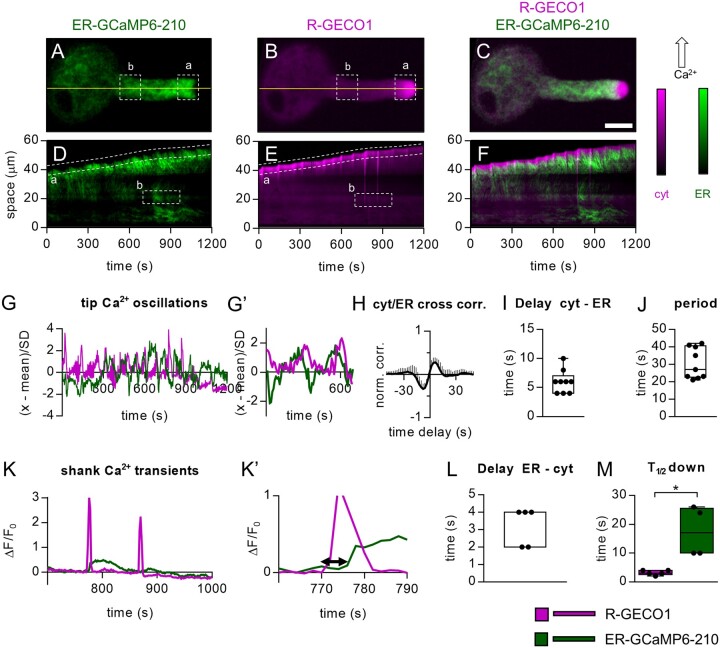
Figure 3.
Simultaneous ER-GCaMP6-210 and R-GECO1 fluorescence signals in growing pollen tubes. A–C, Images of a representative pollen tube. A, Green: ER-GCaMP6-210 fluorescence. B, Magenta: R-GECO1 fluorescence. C, Overlay of (A) and (B). Scale bar 20 µm. D–F, Kymograph extracted from both fluorescence signals frames by observing the temporal evolution of the pixel line highlighted in yellow. D, Kymograph of 1,200 s acquisitions extracted for the R-GECO1 images. E, Kymograph of 1,200 s acquisitions extracted for the ER-GCaMP6-210 images. F, Overlay of (D) and (E). (a) = selected ROI for analyses of pollen tube tip fluorescence signals. (b) selected ROI for analyses of pollen tube shank fluorescence signals. G, Representative oscillations of ER-GCaMP6-210 and R-GECO1 fluorescences in the tip (ROI “a”). G′, same as panel (G) but x-axis, y-axis scales, and ranges adjusted. H, Normalized cross-correlation analysis between R-GECO1 and ER-GCaMP6-210 averaged in temporal sliding windows of 80 s over n = 9 measurements. The peak-value is 0.28 ± 0.11, and it is reached at positive delays, implying that the fast oscillations in the cytosol (R-GECO1) are anticipated by the ones in the ER (ER-GCaMP6-210). I, Distribution of the average delays by locating in time the maximum of the cross-correlations, for each experiment considered. The global temporal lag is 6 ± 2 s. J, Distribution of the period of the fast oscillations in the ER/Cytosol. It is defined by doubling the temporal distance at which the signals correlate (maximum in G) and anti-correlates (minimum). The average is 30 ± 11 s. K, Representative ER-GCaMP6-210 and R-GECO1 fluorescences in the shank (ROI “b”). K′, same as part (K) but x-axis, y-axis scales and ranges adjusted. The double arrow in (K’) indicates the delay time quantified in (L). L, Mean delay of the fluorescence increase of the ER-GCaMP6-210 compared to the fluorescence change of the R-GECO1. M, Time required to pass half-maximal ER-GCaMP6-210 and R-GECO1 fluorescence emissions during recovery after the spike. n = 5. Error bars = SD, *P ≤ 0.05 (Student’s t test).

