Figure 4.
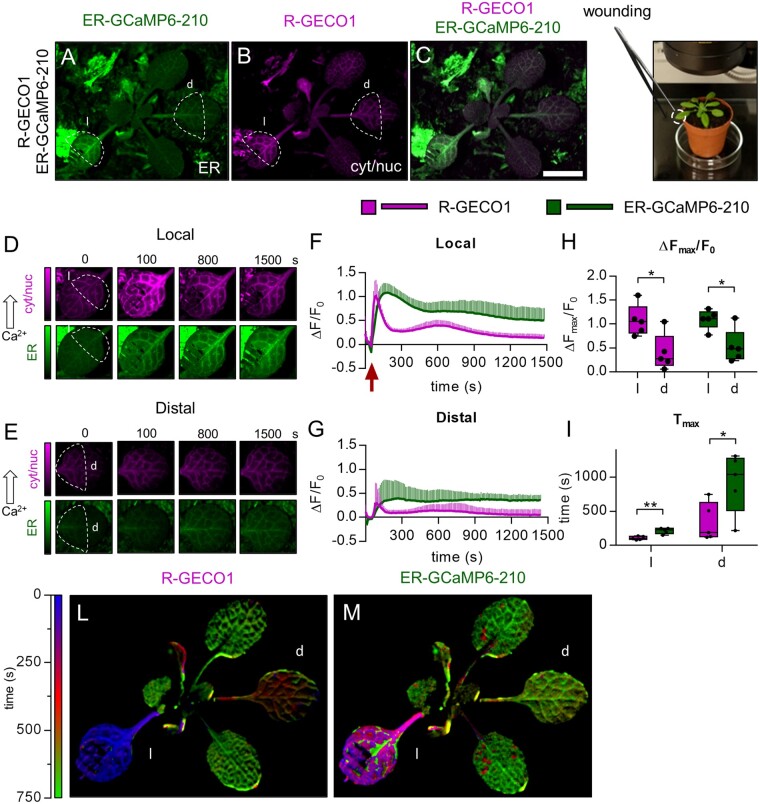
Simultaneous cytosolic and ER Ca2+ analyses in leaves of adult plants challenged with leaf wounding. A–C, Images of a representative pUBQ10-ER-GCaMP6-210 x pUBQ10-R-GECO1 mature plant. A, Green: ER-GCaMP6-210 fluorescence. B, Magenta: R-GECO1 fluorescence. C, Overlay of (A) and (B). Scale bar 1 mm. D, Examples of false-color images illustrate R-GECO1 (magenta) and ER-GCaMP6-210 (green) in a local wounded leaf (“l”). F, R-GECO1 and ER-GCaMP6-210 normalized fluorescence changes of the local leaf (“l”) over the time after its wounding (red arrow). E, Examples of false-color images illustrate R-GECO1 (magenta) and ER-GCaMP6-210 (green) of a distal leaf of the same wounded plant of (D). G, R-GECO1 and ER-GCaMP6-210 normalized fluorescence changes of a distal leaf (“d”) over the time after wounding of “l”. H, Maximal peaks of ER-GCaMP6-210 and R-GECO1 fluorescence signals in the local and distal leaves after wounding. I, Time required to reach maximal peaks of ER-GCaMP6-210 and R-GECO1 fluorescence signals in the local and distal leaves after wounding. n = 5. L and M, Digitally extracted images of a representative pUBQ10-ER-GCaMP6-210 × pUBQ10-R-GECO1 plant for comparative analyses of the temporal evolution of Ca2+ dynamics in the cytosol and ER compartments in response to leaf wounding. L, Temporal analysis of the ΔF/F0 signal peak in the leaves for the R-GECO1. The temporal window analyzed is of 750 s. The color-bar encodes the time at which the maximum signal is recorded in each pixel. The wounded leaf is colored with blue, since it peaks at around 30 s. The distal leaf is reddish because the maximum signal happens at 500 s. The other two leaves showed a delayed response, at 750 s. M, Same analysis for the ER-GCaMP6-210 as in (L). The wounded leaf responded earlier (200 s, violet) than the distal one (750 s, green). Error bars = sd, *P ≤ 0.05, **P ≤ 0.005 (Student’s t test).

