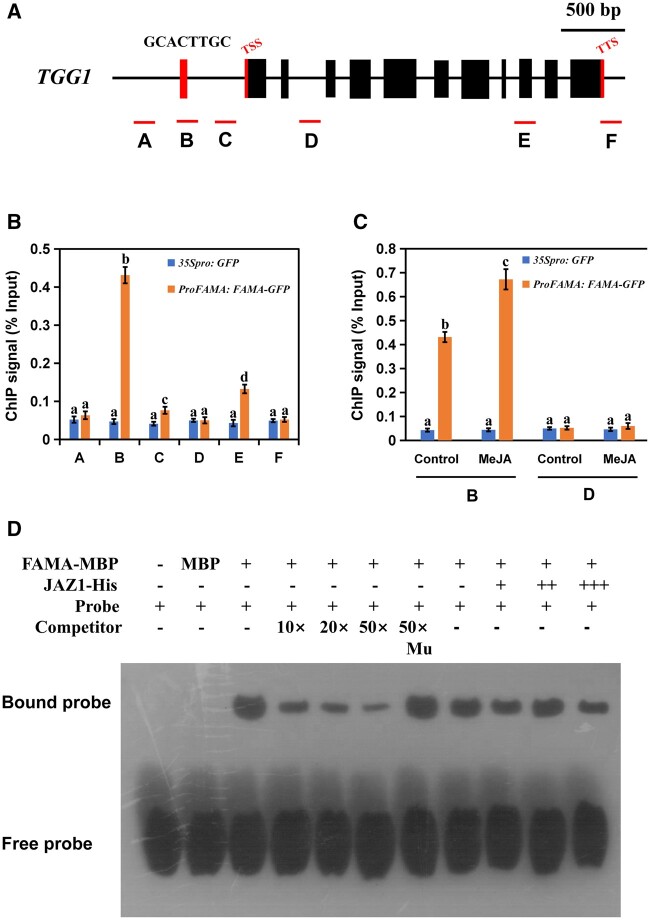
Figure 7.
FAMA could occupy the G-box-like region in the promoter of TGG1. Schematic diagram of TGG1 indicating the amplicons and probe used for the ChIP-qPCR assay and EMSA. A–C are located in the promoter region of TGG1; D is located in the second intron region of TGG1; E contains the ninth exon and part of the intron region of TGG1; F is located in the 3′-UTR region of TGG1. Positions of the transcription start site and transcription termination site are indicated with thin red bars. B, ChIP-qPCR assays showing that FAMA associates with the TGG1 locus. The chromatin of transgenic plants expressing ProFAMA: FAMA-GFP or 35Spro: GFP was immunoprecipitated with an anti-GFP antibody, and 35Spro: GFP plants served as control. Immunoprecipitated chromatin was analyzed by RT-qPCR using primers corresponding to the amplicons represented by the schematic diagram of TGG1 (A). ChIP signal is displayed as the percentage of total input DNA. Means ± sem are relative values obtained from three technical replicates; different letters represent significant differences (P < 0.05, Student’s t test). C, Dynamic recruitment of FAMA to the TGG1 locus. ChIP assays were performed as in (B), except that ProFAMA: FAMA-GFP and 35Spro: GFP plants were treated with 100 μM of MeJA for 30 min before cross-linking. Means ± sem are relative values obtained from three technical replicates; different letters represent significant differences (P < 0.05, Student’s t test). D, EMSA showing that the FAMA–maltose binding protein (MBP) fusion protein binds to the DNA probes of TGG1 in vitro. Biotin-labeled probes were incubated with FAMA–MBP protein or FAMA–MBP and JAZ1-His proteins, and the free and bound DNAs were separated on an acrylamide gel. As indicated, the unlabeled probe and unlabeled mutant probe were used as competitors. Mu, mutated probe in which the 5′-GCACTTGC-3′ motif was replaced with 5′-TTTTTTTT-3′. A gradient concentration of JAZ1-His was applied (0.5 mg for +; 1.0 mg for ++; 1.5 mg for +++).

