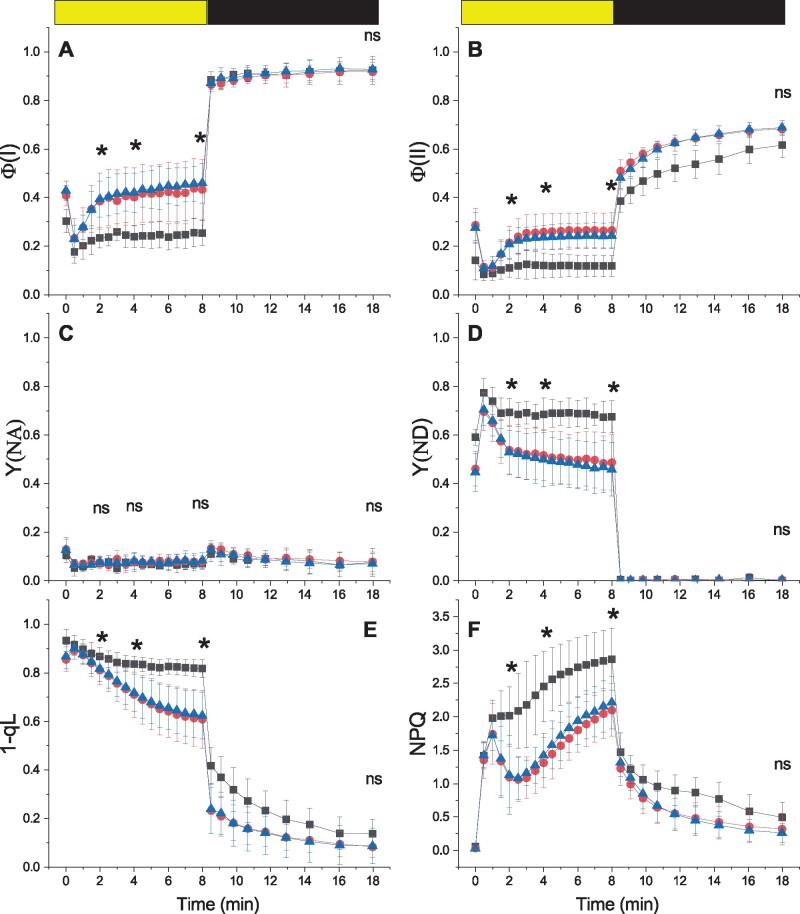
Figure 5.
Alterations in PS functionality in CI mutants. The yield of PSI (Φ(I), A), PSII (Φ(II), B). PSI acceptor side limitation (Y(NA), C), PSI donor side limitation (Y(ND), D). PQ redox state (1-qL, E) and NPQ (F) were measured with Dual PAM 100 in plants exposed to 330 μmol photons m−2 s−1 of actinic light intensity. Yellow/black bar indicates when actinic light was on/off, respectively. WT, ndufb10, and ndufa5 KO are shown, respectively, with black squares, red circles, and blue triangles. Data are shown as average ± sd (n > 4). Asterisks indicate statistically significant differences of both mutants from WT plants (one-way ANOVA, n > 5, P < 0.01) after 2, 4, and 8 min of illumination and after 10 min in the dark; ns indicates nonstatistically significant differences.

