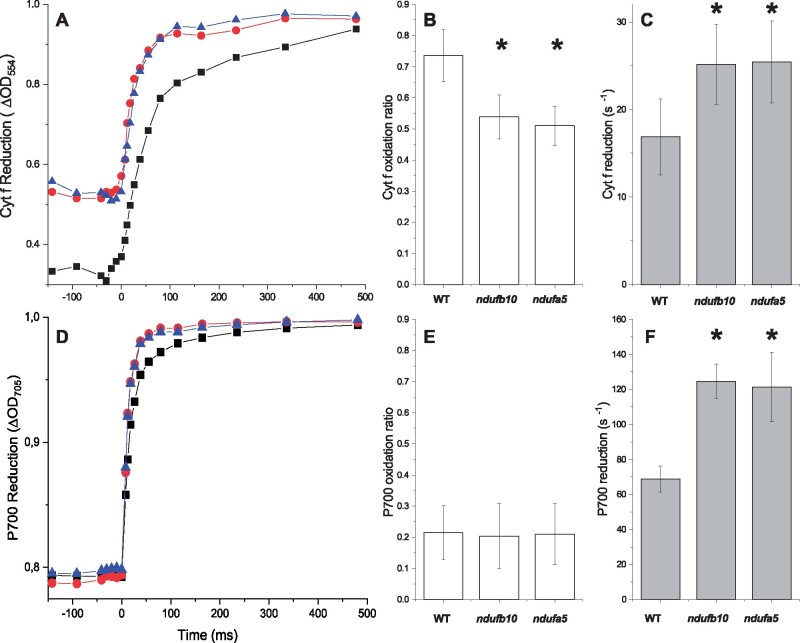
Figure 7.
Cytochrome f and PSI oxidation. A, Cytochrome f reduction monitored from ΔOD554 in dark-adapted plants subjected to constant illumination (300 μmol photons m−2 s−1) for 480 s before the light was switched off. WT, ndufb10, and ndufa5 KO are shown, respectively, as black squares, red circles, and blue triangles. B, Oxidation state is expressed as the ratio between Cyt f signals at the end of illumination and the maximal oxidation levels obtained by addition of DCMU/DBMIB to obtain complete oxidation. Reported values are average ± sd (n ≥ 4). C, Cyt f reduction rate in the different genotypes after 480 s actinic light exposure, quantified from half-time reduction. For B and C asterisks, indicate statistically significant differences (one-way ANOVA, n > 4, P < 0.01). D, PSI reduction monitored from ΔOD705 in dark-adapted plants exposed to constant illumination (300 μmol photons m−2 s−1) for 480 s. WT, ndufb10, and ndufa5 KO are shown, respectively, as black squares, red circles, and blue triangles. E, P700 oxidized fraction is expressed as the ratio between P700+ signals at the end of illumination and the maximal oxidation levels obtained by addition of DCMU and DBMIB to block the PSI re-reduction. Reported values are average ± sd (n ≥ 4). F, P700+ reduction rate estimated from half-time reduction after 480 s actinic light exposure in the different genotypes. Average values ± sd are shown. For F, asterisks indicate statistically significant differences (one-way ANOVA, n > 5, P < 0.01).

