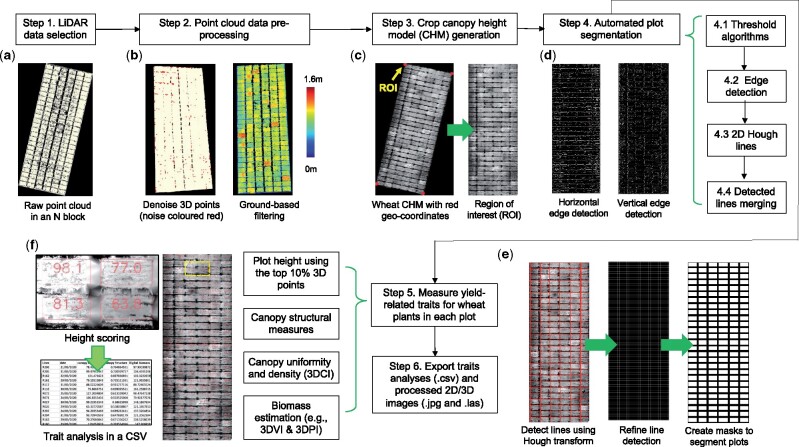
Figure 2.
A high-level analysis pipeline established for processing LiDAR-acquired point clouds and measuring yield-related traits in 3D. A, Select a pre-processed point cloud file (in LAS format). B, Remove outliers (colored red) in the point cloud, followed by filtering methods to differentiate ground-based terrain (e.g. soil level below the crop) and above-ground (crops) 3D points. C, Generate a 2D CHM and define the ROI (denoted by the four red markers) using geo-coordinates collected by the ground-based RTK station. D and E, Detect horizontal and vertical edges using the Sobel operator, followed by the application of 2D Hough transform to produce a binary mask to segment plots in the field experiments. F, Measure and export 3D trait analysis results for each plot, including measured traits (CSV), processed images (JPG), and processed point cloud (LAS).

