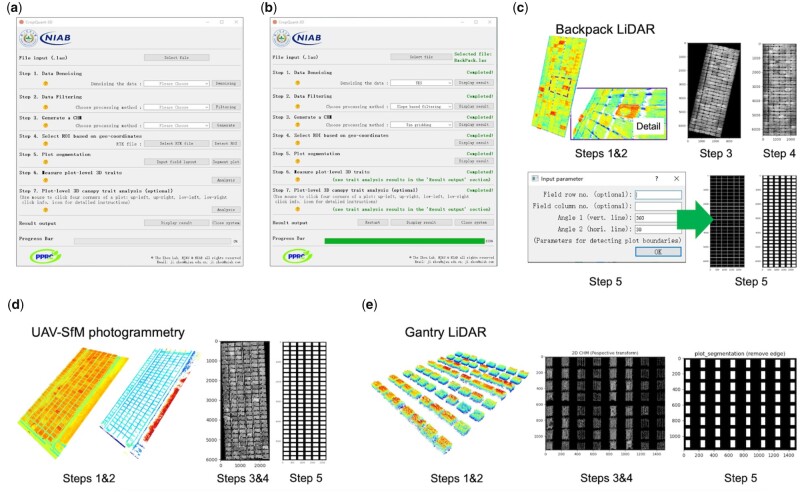
Figure 3.
The GUI for CropQuant-3D was designed for processing 3D point cloud files using 2D/3D image analysis algorithms and mathematic transformation for analyzing canopy structural traits in 3D. A, The initial GUI window of CropQuant-3D. B, The GUI window after accomplishing all required analysis steps, with the progress bar showing 100%. C, The intermediate results that can be displayed for each processing step integrated with the analysis procedure for processing point cloud files generated by the backpack LiDAR, including optional input parameters such as the number of rows and columns of the experimental field that users could enter to assist the algorithm for segmenting plots. D, The intermediate results that can be displayed for processing point cloud files collected by UAV aerial imaging. E, The intermediate results that can be displayed for processing point cloud files generated by a gantry-mounted LiDAR system, FieldScan.

