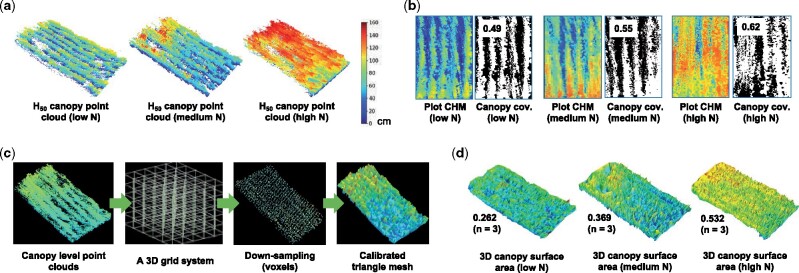
Figure 5.
The analysis process of measuring 3D canopy surface area and canopy coverage at the plot level using voxels and triangular mesh for wheat varieties. A, 3D points for the canopy region using the highest 50% points (H50) in a given plot. B, H50 points projected onto the ground plane, generating pixels representing crop canopy regions, which were processed by an adaptive approach to calculate the normalized canopy coverage trait (0-1, where 1 stands for 100%). C, A brief analysis process of computing the 3D surface area trait using triangle mesh. D, The normalized 3D surface results (0-1, where 1 stands for maximum 3D surface area in a given plot) of a wheat variety under three N treatments.

