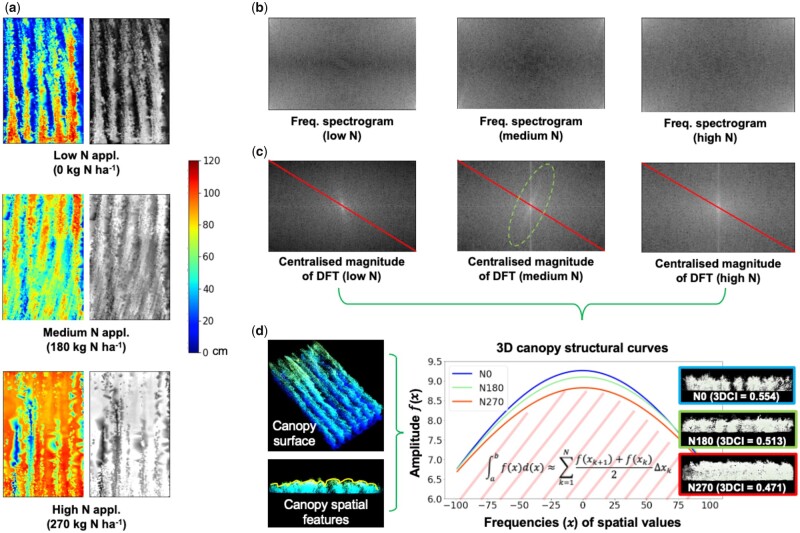
Figure 6.
The analysis procedure of measuring 3D canopy structure at the plot level using 2D CHM images and a 2D DFT, resulting in 3D canopy structural curves for separating variety responses to different N treatments. A, The pseudo-colored height images and their associated grayscale height images (intensity values correspond to height values) in a plot, under three N treatments. B, Frequency spectrograms generated using 2D DFT of the grayscale height images, containing all frequencies of height values and their magnitude in the plot. C, Centralized magnitude of DFT produced to enable frequency and amplitude sampling through red-colored lines on the diagonal of the image; regular patterns observable in the images with medium- and high-N treatments. D, Three canopy structural curves plotted to present structural differences together with cross-sections of 3D points at the canopy level, showing the wheat variety’s different responses to three N treatments as well as the procedure of computing 3DCI (0-1, where 1 stands for maximum accumulated spatial variation in a given plot) based on the curves and areas beneath the curves.

