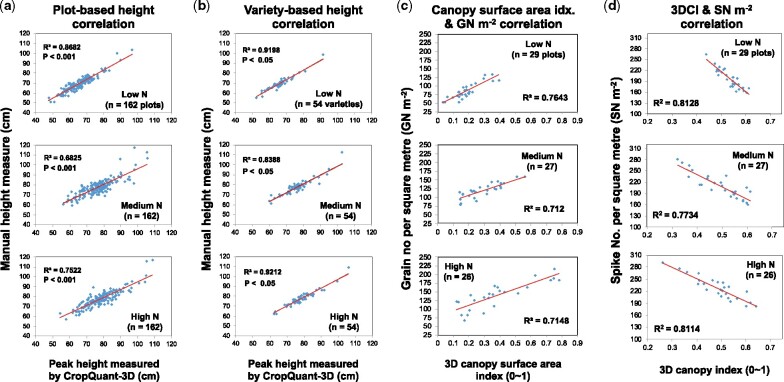
Figure 7.
The square of the correlation coefficient (R2) calculated to evaluate correlations between height estimates, canopy surface area and 3DCI computed by CropQuant-3D and manual measurements in the 2019–2020 field trial, at three different levels of N fertilization; P-values computed through the linear regression analysis also reported. A, Plot-based correlation analysis of the peak height measured by CropQuant-3D and manual height measurements. B, Variety-based correlation analysis of the peak height measured by CropQuant-3D and manual height measurements. C, Correlation analysis of the 3D surface area index and the grain number per unit area (GN m−2) data. D, Correlation analysis between 3DCI and spike numbers per square meter (SN m−2). Plot means (A) and genotype means (B) are shown.

