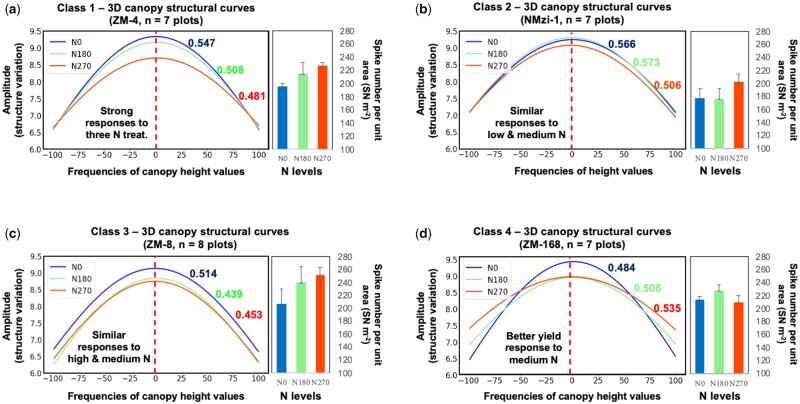
Figure 8.
A case study of classifying wheat varieties’ N responses using the 3DCI and spike number per unit area for 11 varieties from the Zhenmai and Ningmai collections under three N application levels. Error bars used in the spike number per meter square (SN m−2) scores represent one standard error. A, The first N response class, showing canopy structural curves of ZM-4 and the associated spike number per meter square (SN m−2) scores under the three N treatments. Also in this class were varieties NMzi-1019, ZM-5, and ZM-1 (see Figure 6 for the explanation of the measure). B, The second N response class, showing canopy structural curves of NMzi-1 and the associated SN m−2 scores under the three N treatments. Also in this class were NMzi-1, ZM-10, and ZM-12. C, The third N response class, showing canopy structural curves of NM-26 and the associated SN m−2 scores under the three N treatments. Also in this class was ZM-8. D, The fourth N response class, showing canopy structural curves of ZM-168 and the associated SN m−2 scores under the three N treatments. Also in this class was line ZM-09196. Values shown in the corresponding color next to each curve in the plots are computed 3DCI values.

