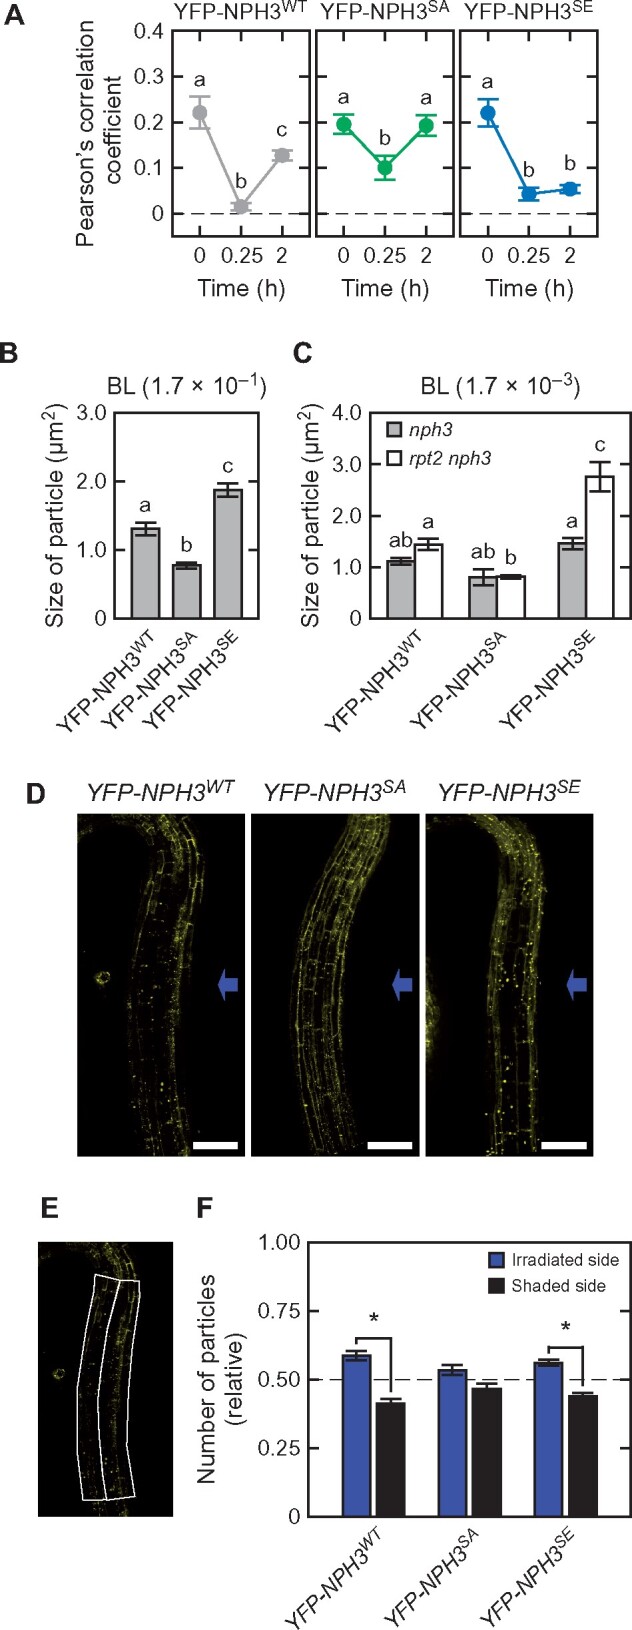
Figure 9.

Quantitative analysis of the subcellular localization of YFP-NPH3 proteins. A, Pearson’s correlation coefficients for the colocalization of YFP-NPH3 proteins with FM4-64. Two-day-old etiolated seedlings were treated with 5 µM FM4-64 and irradiated with BL at 1.7 × 10⁻¹ µmol m−2 s−1 for the indicated times. Pearson’s correlation coefficients between the YFP and FM4-64 signals were measured. The data shown are the mean values ± SE from 18 to 34 seedlings. Different letters on the graphs denote statistically significant differences (Tukey–Kramer multiple comparison, P < 0.05). B and C, Statistical analysis of the sizes of the YFP-NPH3 granules under BL irradiation at 1.7 × 10⁻¹ µmol m−2 s−1 for 0.25 h (B) or 1.7 × 10⁻³ µmol m−2 s−1 for 2 h (C). The data shown are the mean values ± SE from 197 to 235 granules. Different letters on the graphs denote statistically significant differences (Tukey–Kramer multiple comparison, P < 0.05). D, Distribution of the aggregates of YFP-NPH3 proteins across the hypocotyl. Two-day-old etiolated seedlings of the nph3 mutants transformed with 35Spro:YFP-NPH3WT (YFP-NPH3WT: left panel), 35Spro:YFP-NPH3SA (YFP-NPH3SA: mid panel), or 35Spro:YFP-NPH3SE (YFP-NPH3SE: right panel) constructs were irradiated with unilateral BL at 1.7 × 10⁻¹ µmol m−2 s−1 for 1.5 h. Blue arrows indicate the direction of BL. White bar, 100 µm. E and F, Quantification of the number of YFP-NPH3 aggregates in the irradiated and shaded sides of the hypocotyl. The number of YFP-NPH3 aggregates was measured by designating two regions of interest on the irradiated and shaded sides of the hypocotyl (E). The image in (E) is the same as that of YFP-NPH3WT in (D). The counted number was then fixed to those per unit area (7,200 µm2) (F). The data shown are the mean values ± SE from 23 to 31 seedlings. Asterisks indicate a statistically significant difference (paired t test, P < 0.05).
