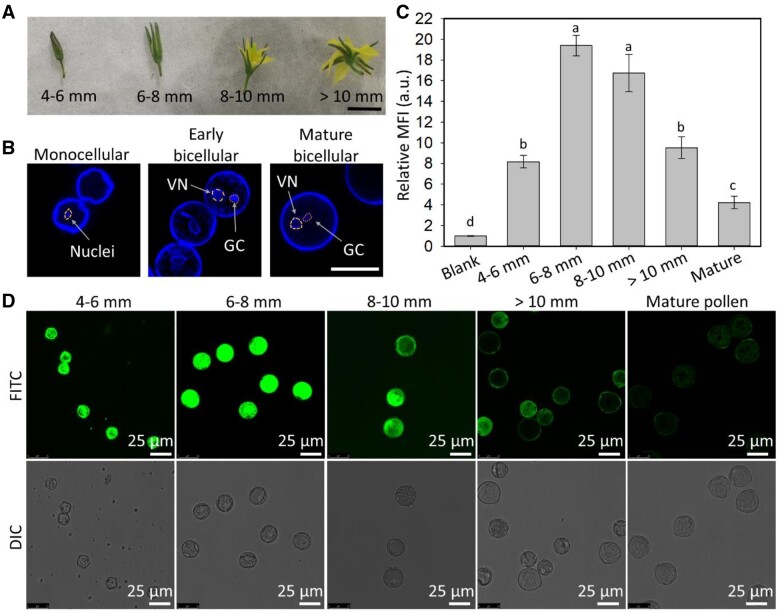
Figure 4.
Internalization of LDH-50 nanoparticles by pollen at different stages of development. A, Representative images of flowers collected at four stages (scale bar, 10 mm). B, Confocal microscope images of monocellular, early and mature bicellular pollen nuclei stained with Hoechst 33342 (VN: vegetative nuclei, GC: generative cell, circles indicate the area of VN and GC, scale bar, 25 μm). C, Flow cytometry data, where lower-case letters indicate a significant difference of P < 0.05 between treatments. Data are shown as mean ± sem for n = 3 biological replicates. D, Confocal microscope images of pollen at different stages of development after incubation for 2 h at room temperature with 50 mg/L of LDH-50-FITC.

