
Figure 3.
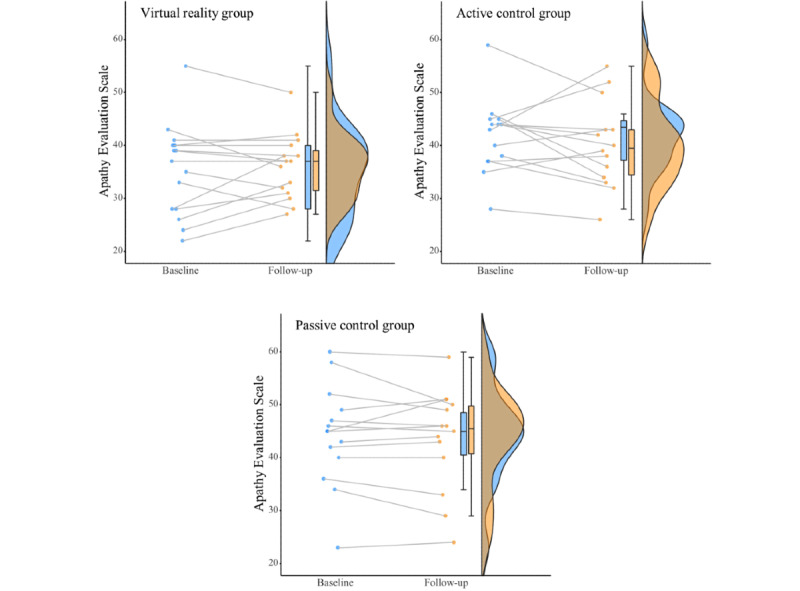
Baseline and follow-up apathy scores for each group with each line representing one participant. Boxplots and rainclouds indicate distribution in baseline and follow-up scores.
Official websites use .gov
A
.gov website belongs to an official
government organization in the United States.
Secure .gov websites use HTTPS
A lock (
) or https:// means you've safely
connected to the .gov website. Share sensitive
information only on official, secure websites.
Baseline and follow-up apathy scores for each group with each line representing one participant. Boxplots and rainclouds indicate distribution in baseline and follow-up scores.