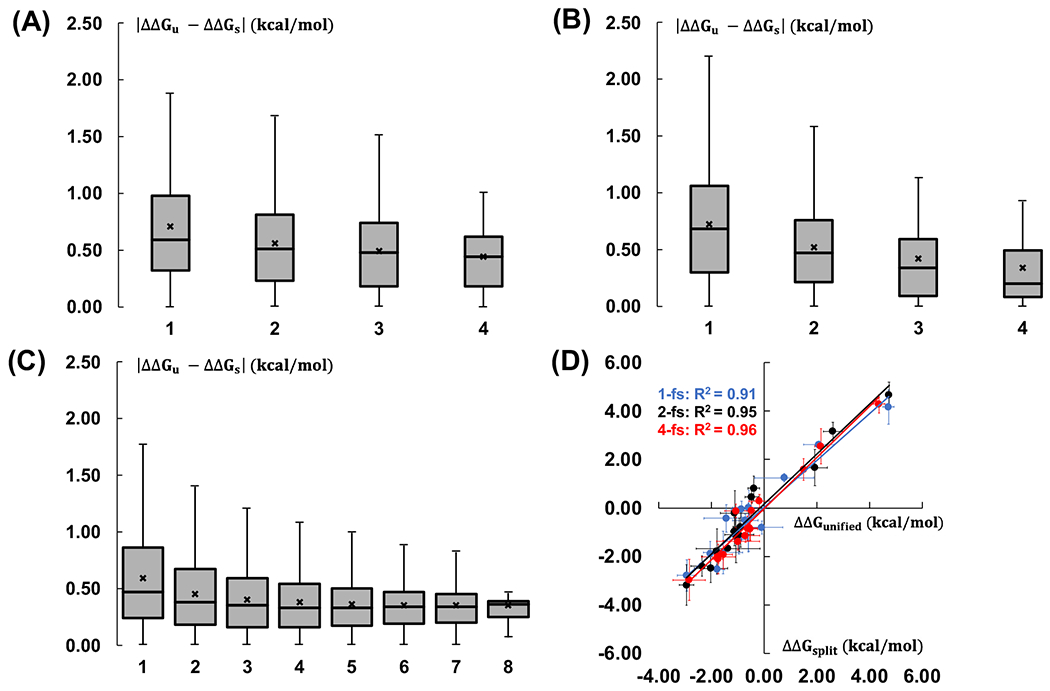
Figure 3.

Mean unsigned energy differences between the unified and split protocols for the AMBER-TI simulations with (A) 1-fs, (B) 2-fs, and (C) 4-fs timesteps. The X-axis is the number of independent runs that are considered for the comparison. The x mark represents the average value of each comparison. All the outliers are not shown in the box and whisker plots. (D) Correlation between ΔΔGbind from the unified and split protocols. ΔΔGbind calculations with 1-fs, 2-fs, and 4-fs timesteps are in blue, black, and red, respectively.
