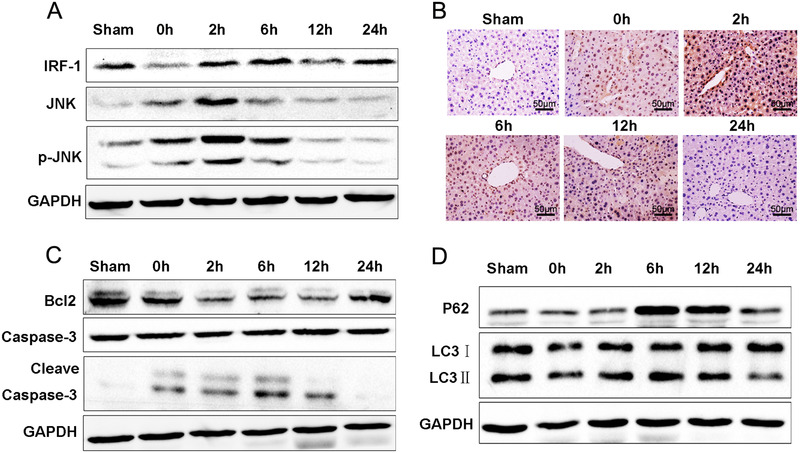
FIGURE 2.

Alterations in IRF‐1 and autophagy in mouse liver IRI. (A) IRI, JNK, and p‐JNK were determined using western blot. Band strength was standardized as based upon the load control of GAPDH. (B) Expressions of p‐JNK in liver as determined using immunocytochemistry (scale bars = 50 μm). (C) Bcl‐2, Caspase‐3, and Cleave Caspase‐3 in livers of sham and IR‐treated mice were determined using immunoblot. Band strength was standardized as based upon the load control of GAPDH. (D) Beclin1, P62, and LC3‐II in livers of sham and IR‐treated mice were determined using immunoblot. Band strength was standardized as based upon the load control of GAPDH
