
FIGURE 2.
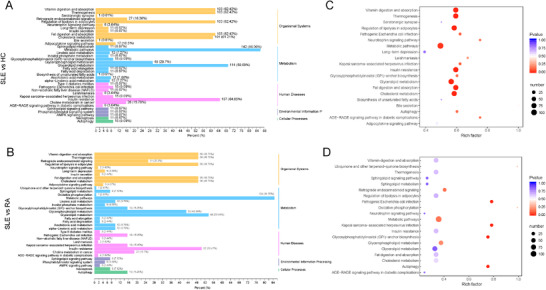
The lipidome KEGG enrichment analysis of SLE patients. (A and C) KEGG pathway analysis of differentially expressed lipids between SLE and HC groups. (B and D) KEGG pathway analysis of differentially expressed lipids between SLE and RA groups. The color of bubbles represents the value of adjusted p‐value, and the size of bubbles represents the number of counts