
FIGURE 4.
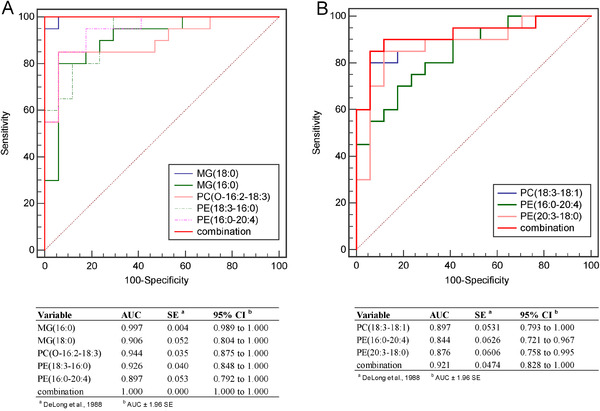
Evaluation potential of lipid metabolites in the diagnosis of SLE from other groups. (A) ROC curve was used to distinguish the patients in the SLE group and HC group; (B) ROC curve was used to distinguish patients in SLE and RA groups
Official websites use .gov
A
.gov website belongs to an official
government organization in the United States.
Secure .gov websites use HTTPS
A lock (
) or https:// means you've safely
connected to the .gov website. Share sensitive
information only on official, secure websites.
Evaluation potential of lipid metabolites in the diagnosis of SLE from other groups. (A) ROC curve was used to distinguish the patients in the SLE group and HC group; (B) ROC curve was used to distinguish patients in SLE and RA groups