FIGURE 3.

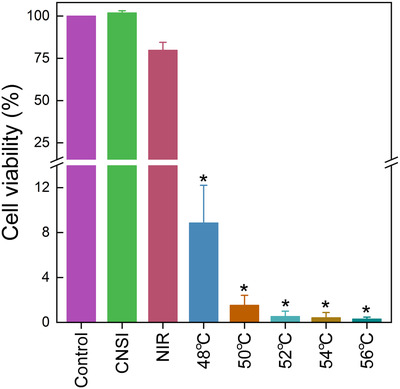
Cell viability of TPC‐1 cells after CNSI+NIR treatment at different temperatures. * P < .05 compared with control group (n = 3)

Cell viability of TPC‐1 cells after CNSI+NIR treatment at different temperatures. * P < .05 compared with control group (n = 3)