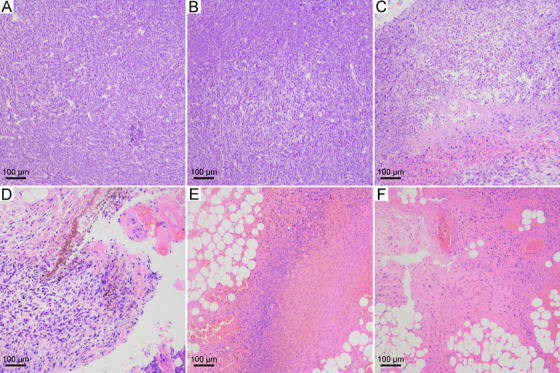
FIGURE 6.

HE staining images of tumor tissues after the treatments: (A) control group; (B) CNSI group; (C) NIR group; (D) CNSI+NIR (50°C) group; (E) CNSI+NIR (53°C) group; and (F) CNSI+NIR (56°C) group

HE staining images of tumor tissues after the treatments: (A) control group; (B) CNSI group; (C) NIR group; (D) CNSI+NIR (50°C) group; (E) CNSI+NIR (53°C) group; and (F) CNSI+NIR (56°C) group