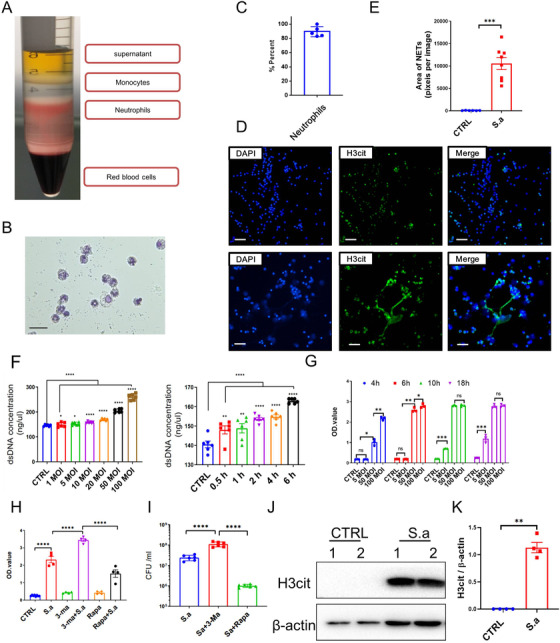
FIGURE 4.

Staphylococcus aureus infection promotes NETs formation in vitro and in vivo. A, Neutrophils were separated from mouse peripheral blood mononuclear cells (PBMCs) by density gradient centrifugation. B, Neutrophils were identified and stained with Swiss‐Giemsa buffer. C, Histogram analysis of neutrophils purity. The purity of neutrophils was determined in five different sections, each of which was recorded from 10 independent sections. D, Representative images of S. aureus‐triggered NETs formation in vitro. Purified neutrophils were infected with or without S. aureus for 6 h, and then stained with DAPI and anti‐H3cit for NETs formation identification in vitro. E, The quantification results of NETs areas by ImageJ. F, XTT cell viability assay to determine the cell death of neutrophils treated with S. aureus. Neutrophils cytotoxicity was analyzed following S. aureus infection in a time‐ and dose‐dependent manner. G, Neutrophil‐free dsDNA was increased under S. aureus infection. Neutrophil was stimulated with S. aureus in dose‐ and time‐dependent manner, supernatants were harvested, and free dsDNA was detected by PicoGreen dsDNA detection kit. H, Lactate dehydrogenase (LDH) assay of neutrophil pretreated with the autophagy inhibitor 3‐MA and the agonist rapamycin. I, Bacterial burden in neutrophil supernatants was detected following 3‐MA and rapamycin treatment. J, Immunoblotting analysis of S. aureus‐triggered NETs formation in vivo. Mice were treated with a sublethal dose of S. aureus, and lung tissues were harvested and analyzed with H3cit. K, The quantification analysis of H3cit band. Statistical analysis was performed by Student's paired t‐test between two groups, and one‐way ANOVA for three or more groups. Scale bars, 50 µm. The data represent three independent experiments and are shown as the mean ± SEM. * P < .05, ** P < .01, *** P < .001, and **** P < .0001
