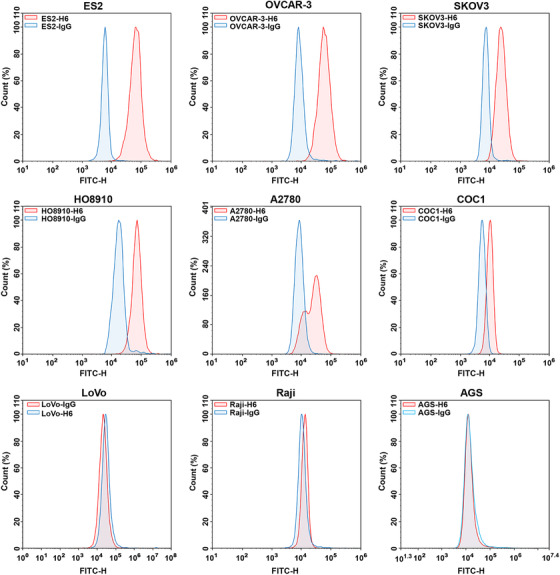
FIGURE 3.

5T4 protein expression on the surface of ovarian cancer cells. FCM analysis of tumor cells with isotype IgG (blue) or H6 antibody (red), respectively. Since all ovarian cancer cell lines were positive for 5T4 expression, three additional negative cell lines were added
