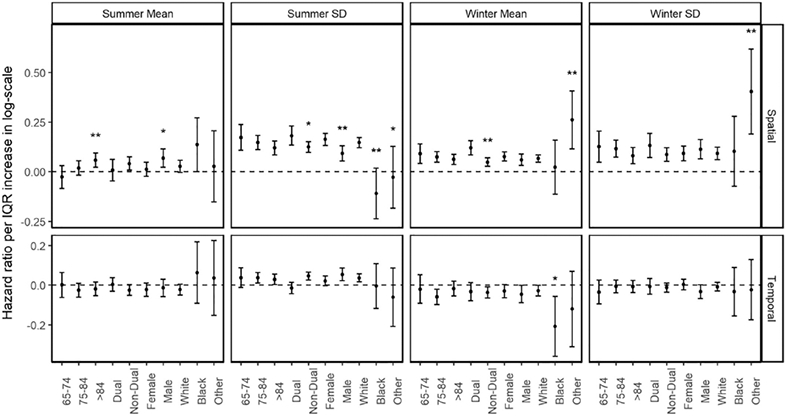
Fig. 2. Modifications of spatial contrasts and temporal deviations of general temperature indices.

Results are expressed as hazard ratios (95% CIs) in a logarithmic scale per IQR increase in degree Celsius. Level of statistical significance when compared with reference category in each subgroup: p < 0.01 (**). Level of statistical significance when compared with reference category in each subgroup: p < 0.05 (*).
