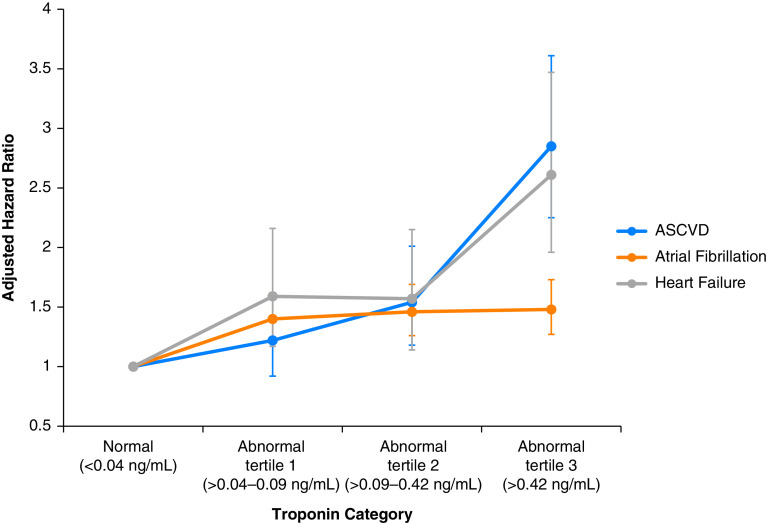
Figure 3.
Multivariable association between peak troponin I level during sepsis and postdischarge risks of individual types of cardiovascular events. Each circle represents a category of peak troponin I elevation during a hospitalization for sepsis and shows the adjusted hazard ratio (and associated 95% confidence interval) of that troponin I level and an individual cardiovascular complication at 1 year after discharge. The blue line represents the adjusted hazards of atherosclerotic cardiovascular disease (ASCVD), the orange line the adjusted hazards of atrial fibrillation, and the gray line the adjusted hazards of heart failure. Modest troponin elevation was associated with increased risks of each individual cardiovascular complication, most pronounced in ASCVD and heart failure events.

