Figure 1.

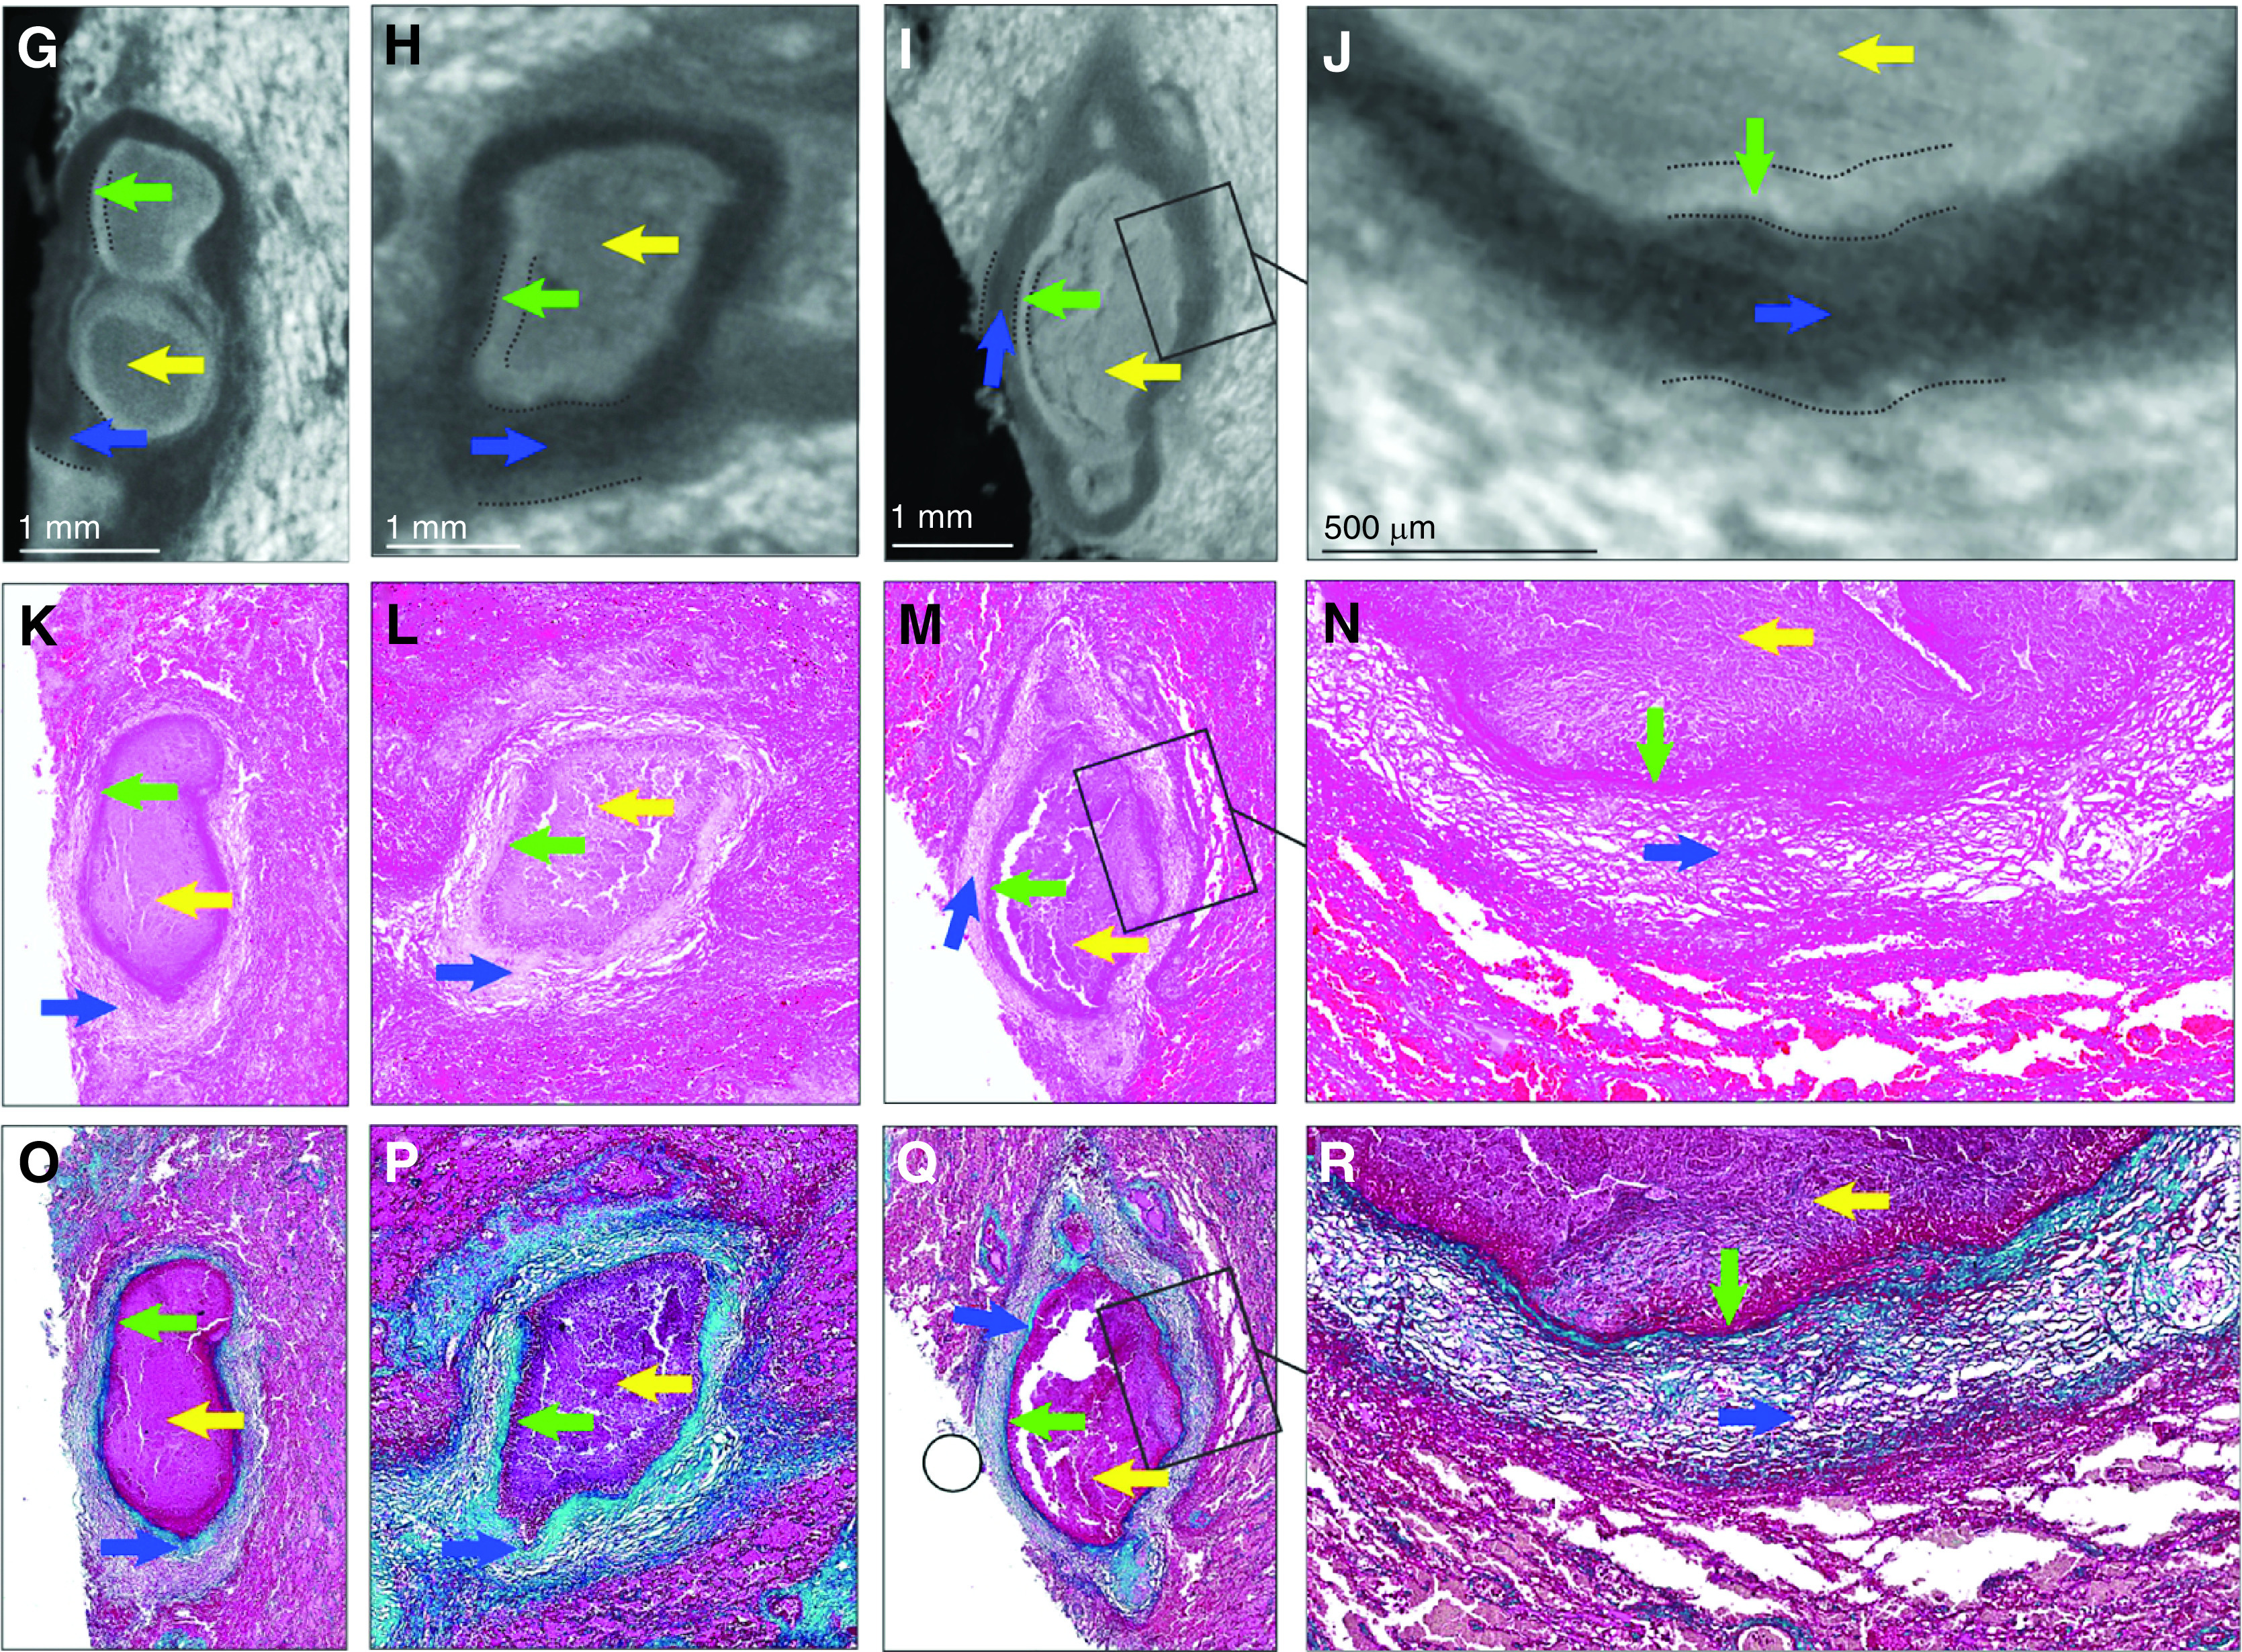
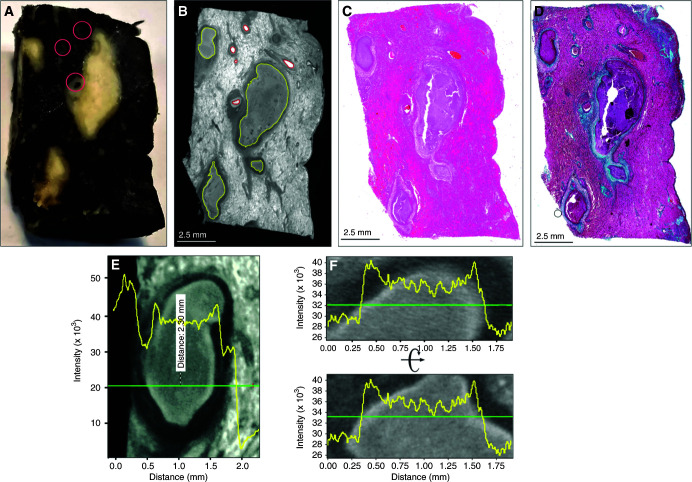
Micro computed tomography (μCT) and histology of human tuberculosis lung with caseous necrotic granulomas. (A) Gross image of tissue exhibiting caseous necrosis. Pink circles indicate blood vessels. (B) μCT (12.0-μm resolution) of tissue in A, showing caseous necrosis (yellow outlines) and blood vessels (red outlines). (C) Hematoxylin and eosin histology of B. (D) Masson’s trichrome histology of B. (E–J) Necrotic regions have a “halo-like” appearance with a slightly brighter outer shell (green arrows) surrounding a slightly darker interior (yellow arrows). The green arrows indicate denser necrotic material likely derived from a necrotic bronchial epithelium (see also Figure E1 in the online supplement). Necrotic regions are surrounded by a dark border (blue arrows). (E and F) Typical X-ray opacity profile (yellow line graph) across necrotic granulomas measured along the green axis. X-ray attenuation is proportional to intensity and is visualized inversely, with denser regions appearing brighter. Intensity is a combination of tissue density and iodine (contrast stain) affinity. Dark fibrotic regions are followed by a slightly more opaque ring that surrounds the (lighter) lesion. (G–J) Representative μCT images of caseous necrotic lesions. Dotted lines indicate region borders. (K–N) Hematoxylin and eosin and (O–R) Masson’s trichrome histology corresponding to G–J reveal the darker border (blue arrows) surrounding the necrotic regions corresponding with fibrotic tissue. Boxed regions in I, M, and Q are shown at high magnification in J, N, and R, respectively. Scale bars: B–D, 2.5 mm; G–I, 1 mm; J, 500 μm. Reprinted by permission from Reference 41.

