Figure 3.
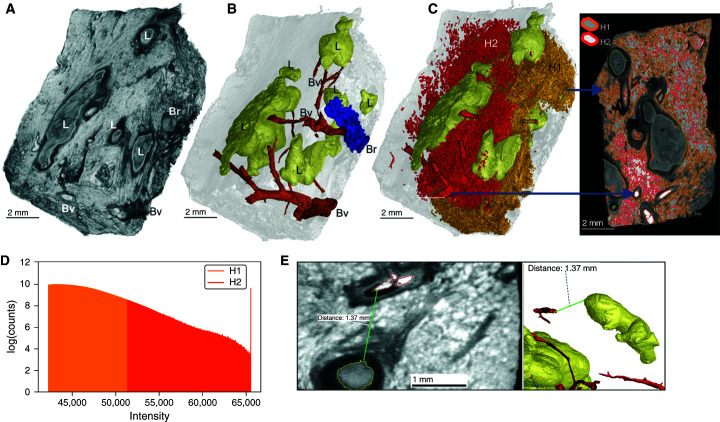
Heterogenous caseous granuloma morphology and surrounding vasculature. (A) Tissue sample exhibiting caseous necrotic granulomas. ScatterHQ (VG Studio) rendering of surface electron density was used. (B) Three-dimensional (3D) segmentation and two-dimensional slice of blood vessels (Bv; red), bronchioles and/or airways (Br; blue), and truncated lesions (L; yellow). (C) The 3D segmentation of lesions (yellow) and hemorrhaging (red and orange). Bv and nearby regions of hemorrhaging have a relatively high signal intensity, with decreasing intensity being demonstrated further away from the Bv. By selecting all regions above a high-intensity threshold (H2; red), hemorrhaging (including intact vasculature) can be quickly segmented. The selection of regions at a lower threshold (H1; orange), which includes H2, also selects other components outside the hemorrhaged region (e.g., within the lesions). The H1 region shown as partially clipped to reveal the H2 region. (D) Intensity distributions of H1 (orange) and H2 (red) regions demonstrating that the H2 region is included in the H1 region. (E) Representative micro–computed tomography slice of segmented regions from A demonstrating the distances between the (curved) granulomas and the vasculature. The 3D visualization allows for more accurate distance determination compared with histology, which will often not capture the minimum distance. Scale bars: A–C, 2 mm; E, left image, 1 mm. Reprinted by permission from Reference 41.

