Figure 7.
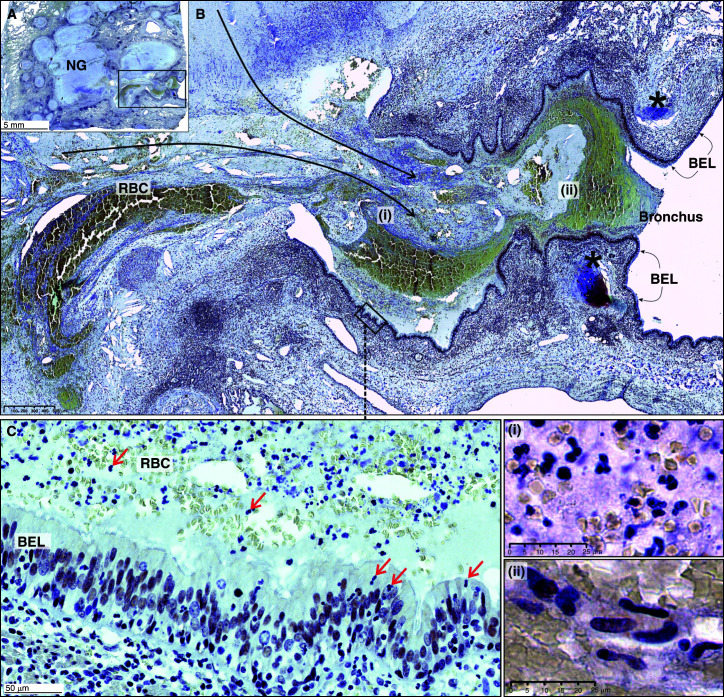
Bronchial obstruction of a Mycobacterium tuberculosis–infected human lung. (A) Low-power magnification of acid sphingomyelinase (nuclear) staining. Note the spilling of necrotic material from necrotic granulomas (NGs) into an airway. These NGs are surrounded by foam cells (see Figure E11 in the online supplement). (B) Medium-power image (black asterisks indicate cartilage, and long black arrows indicate spillage of necrotic material into the bronchus) of the boxed area in A. (C) High-power depiction of the bronchial epithelial layer (BEL) with immune cells in the airway (boxed area in B). Red arrows indicate neutrophils in the lumen and BEL. (i) High-power depiction of immune cells, nuclear debris, and RBC in the necrotic lumen. (ii) High-power depiction of epithelioid histiocytes in the necrotic lumen. Scale bars: A, 5 mm; B, 500 μm; C, 50 μm; i and ii, 25 μm. RBC = red blood cells.

