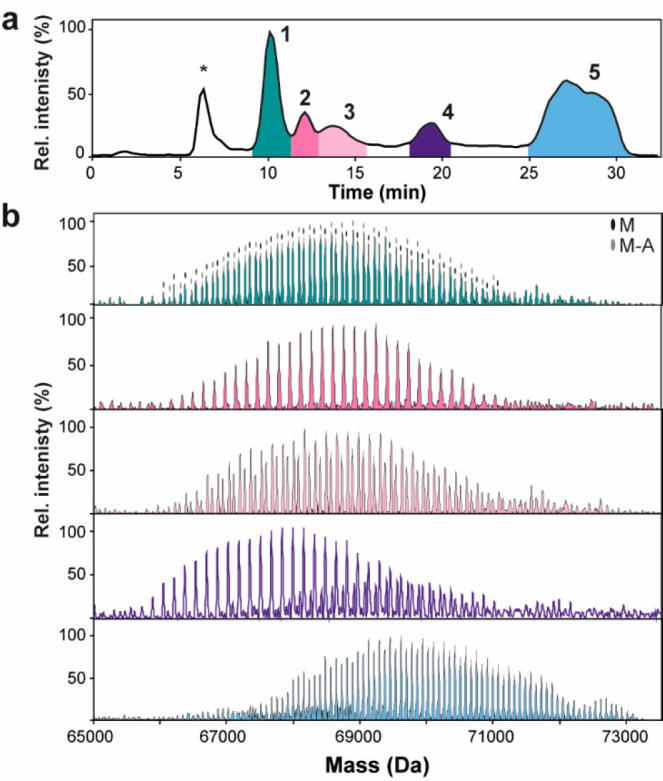
Figure 1.

(a) BPC of the optimized AEX-MS method. The peak marked with * is an unknown species (see Figure S4). EndoPro proteoforms (numbered with 1–5) were separated based on a charge with a decreasing pH gradient. The pH was monitored using an inline pH meter, revealing a linear decrease in pH during elution of most EndoPro proteoforms (Figure S4c). (b) Zero charge deconvoluted native mass spectra of AEX-MS method: Fraction 1 (green), Fraction 2 (pink), Fraction 3 (pale pink), Fraction 4 (purple), and Fraction 5 (blue). In the spectrum of Fraction 1, the different sequence variants are indicated (i.e., M and M-A). Expanded spectra can be found in Figure S5.
