
Figure 3.
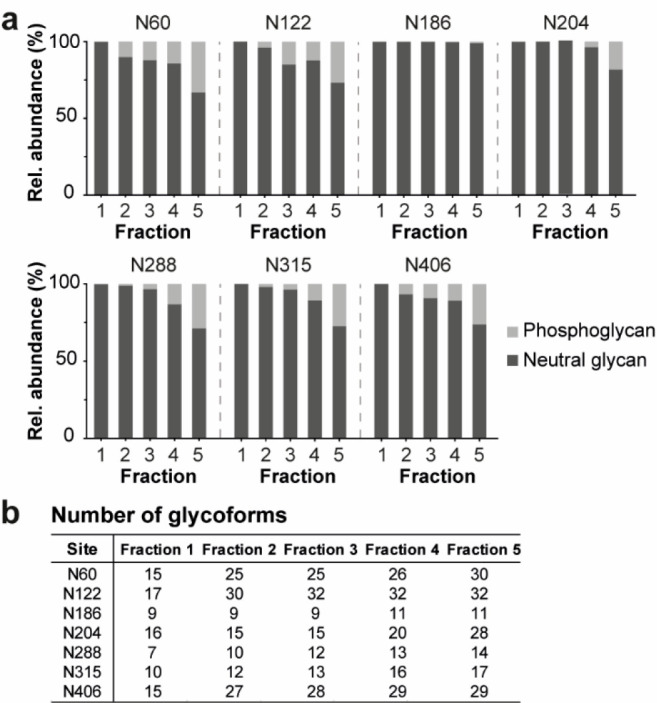
Glycopeptide profiling of the AEX fractions. (a) The phosphorylation level of the glycans expressed as relative abundance of neutral and phosphoglycans for all seven N-glycosylation sites (i.e., N60, N122, N186, N204, N288, N315, and N406). The bars represent the average of two replicates. See Table S2 for more details. (b) The microheterogeneity of each glycosylation site for all AEX fractions. The detailed glycopeptide profile per site of Fractions 1–5 is shown in Figure S8.