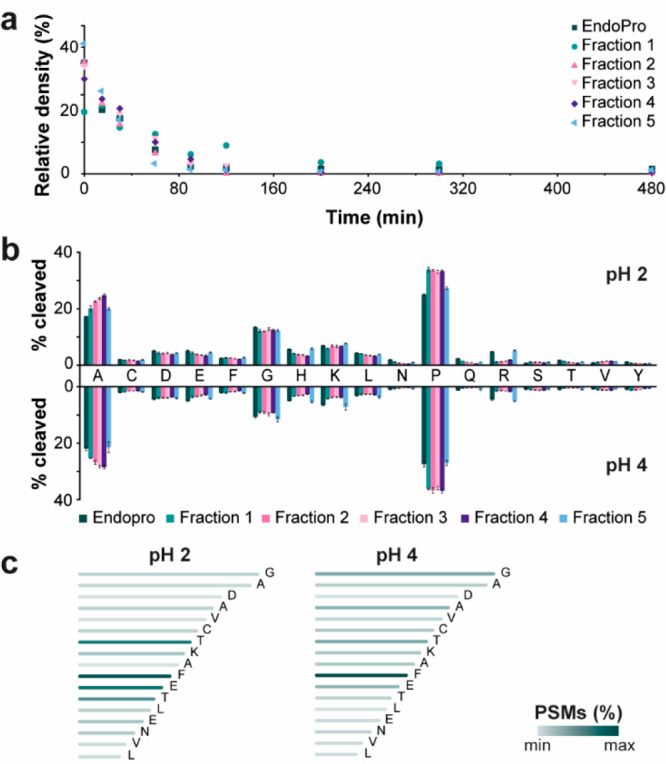
Figure 5.

(a) Digestion of CytC by EndoPro or AEX fractions at pH 4 incubated for different times (i.e., 0, 15, 30, 60, 90, 120, 200, 300, and 480 min). The y-axis represents the relative density of the band of the undigested CytC and the x-axis the incubation time of the protease with CytC at 37 °C. The gel of digestion with EndoPro is shown in Figure S9. (b) The cleavage specificity of EndoPro and AEX fractions at pH 2 (upper part) and pH 4 (lower part). The x-axis shows the C-terminal amino acids of the BSA peptides generated by protease digestion. The data is a mean percentage (n = 4) of total cleavages of BSA per protease. The error bars show standard deviations. See the Experimental Section for details on the experimental procedure. (c) An example of C-terminal ragging for peptide “FDEHVKLVNELTEFAKTCVADESHAG”. The color indicates the relative number of PSMs detected for this peptide.
